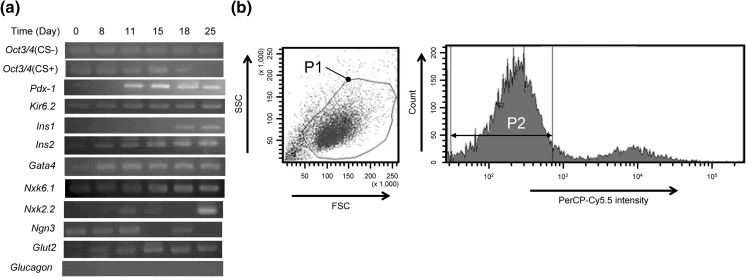
Fig. 3.
Gene expression profiles during stages 2–5 and cell sorting. a Results of RT-PCR. Oct3/4 (CS +) indicates a sample that was applied to cell sorter at 18th day and then cultured until 25th day. Oct3/4 (CS-) indicates a sample that was cultured without cell sorting. b A flow cytogram for the selection of SSEA-1 negative and viable cells. P1 roughly encircles a sorting gate for viable cells. P2 indicates a sorting gate for SSEA-1 negative cells. SSEA-1 was labelled with PerCP-Cy5.5. Cells within the double gate of P1 and P2 were collected

