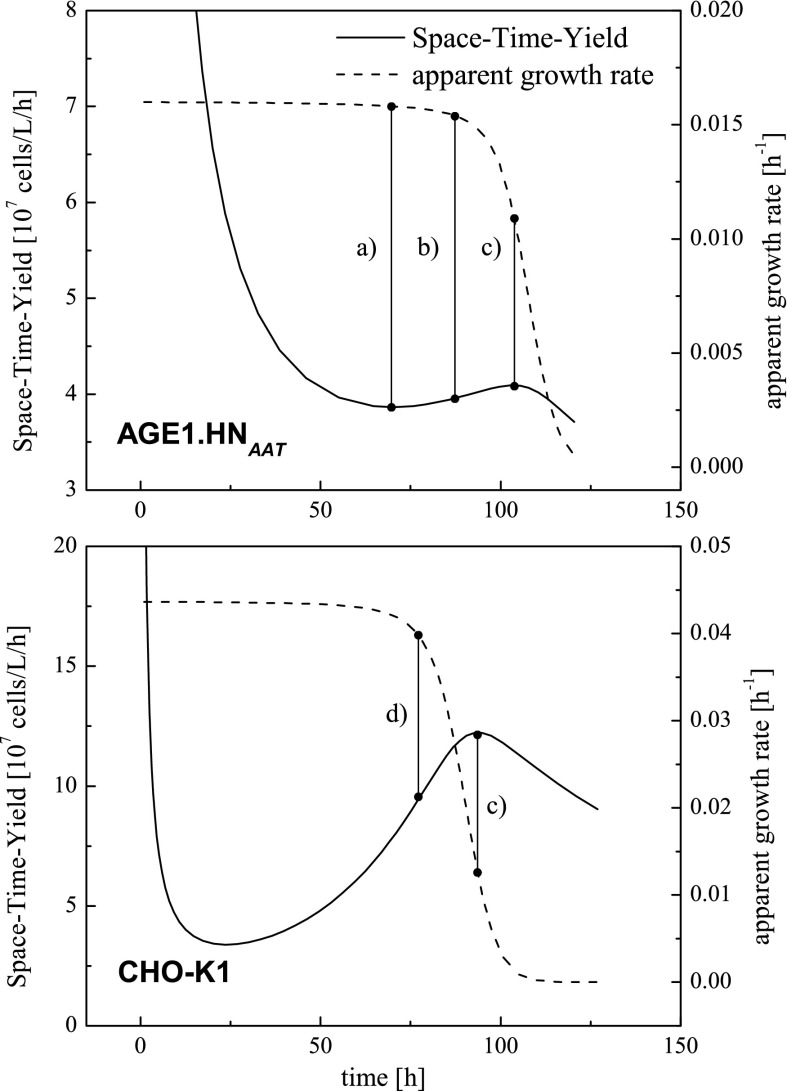
Fig. 5.
Examples of simulated courses of Space–Time–Yield and apparent (effective) growth rate over time regarding a batch cultivation of AGE1.HNAAT cell line: a point in time of minimal STY, b average value of points in time of minimal and maximal STY, c point in time of maximal STY. Analog courses regarding a batch cultivation of CHO-K1 cell line: c point in time of maximal STY and d point in time of apparent (effective) growth rate decrease to 90 %

