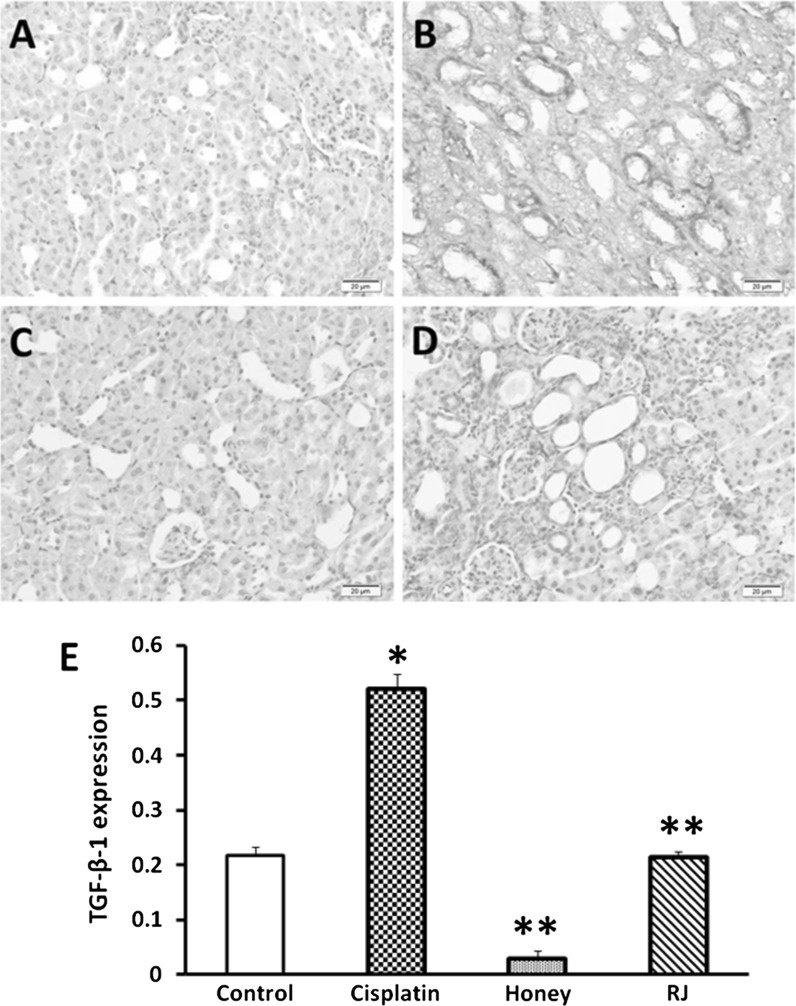
Fig. 3.
Immunohistochemical staining of TGF-β-1, ×100. a Control untreated kidney showing minimal expression of TGF within the renal tubular epithelial cells. b Cisplatin treated rat showing many positive epithelial cells in the renal tubules. c Honey treated rats revealing low reactivity. d RJ treated rats showing reduced reaction. e Data represent the expression level of TGF-β-1 in cisplatin, honey, and RJ groups: *significant difference from normal control group at P < 0.05, **significant difference from cisplatin group at P < 0.05

