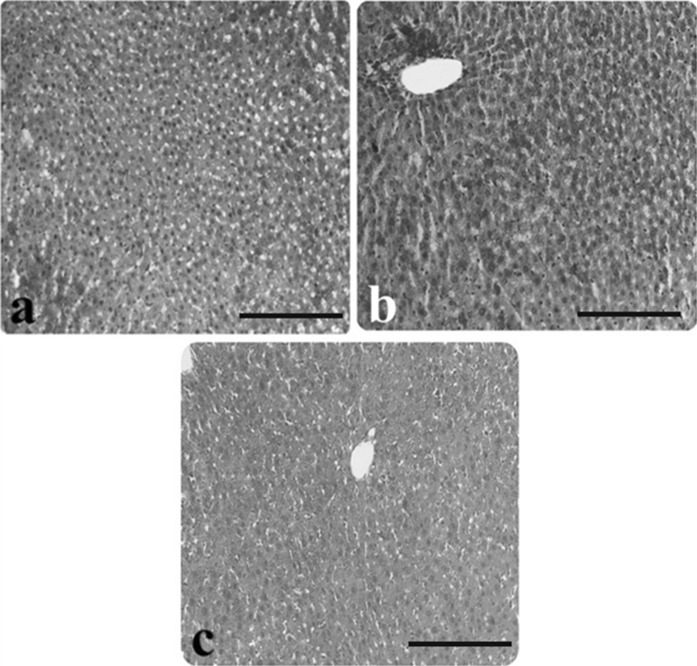
Fig. 7.
Light microscopic appearance of liver tissue following CAR exposure in AP rats. a AP + 50 mg/kg the CAR group, b increased glycogen content in the liver of the AP + 50 mg/kg CAR group, c liver histology similar to controls in the AP + 50 mg/kg CAR group, (PAS staining). Scale bars in a, b, c 50 µm

