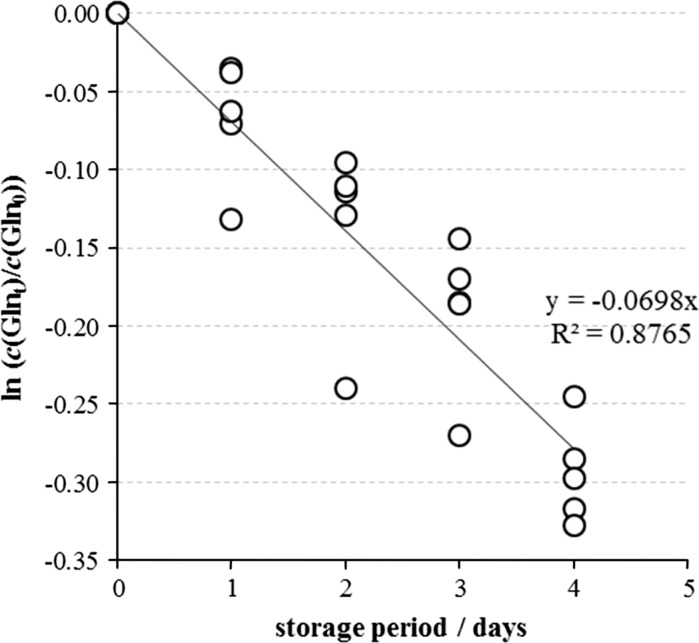
Fig. 5.
l-Gln concentration decrease in five individual samples of the MEM-H(0) incubated at 37 °C. Each point represents individual ln (c(l-Glnt)/c(l-Gln0)) value. The l-Gln decomposition followed first order kinetics, whose rate constant was calculated from the slope of the line describing relationship between ln (c(l-Glnt)/c(l-Gln0)) values and incubation period in days

