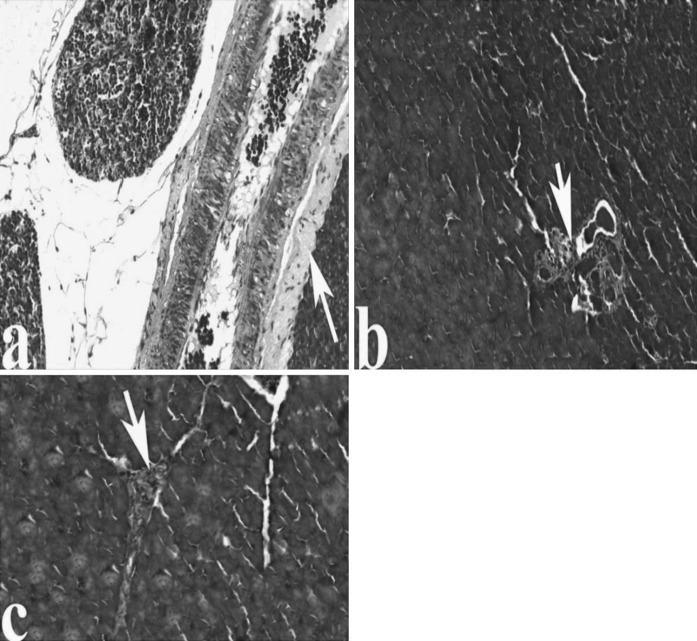
Fig. 5.
The pancreas tissue following CAR exposure in AP rats; a, b in the 50 and 100 mg/kg CAR groups, decreased collagen fibers in veins, respectively. c The pancreatic structure is similar to controls in the AP + 200 mg/kg CAR group. Fibrosis symbols are as in Fig. 2, (Masson trichrome stain)

