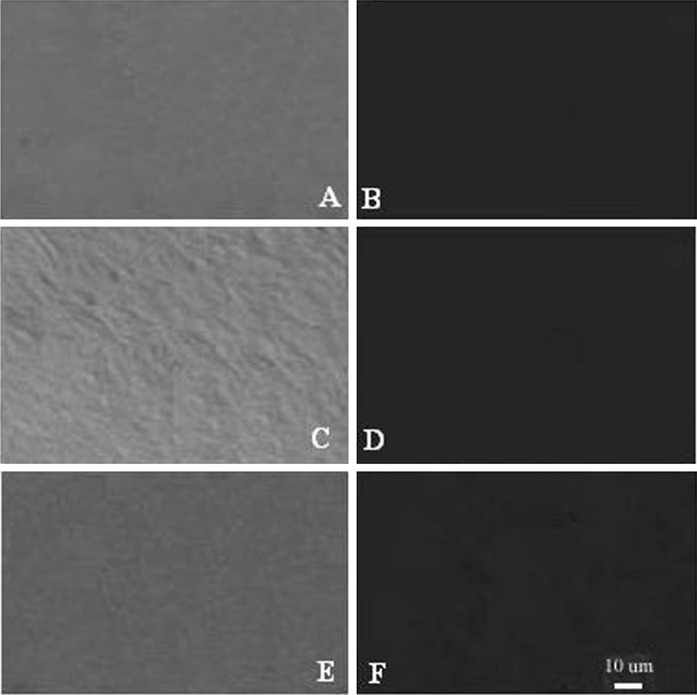
Fig. 3.
cTnI, Desmin and Nkx2.5 expression in the control group 4 weeks after induction assayed by the immunofluorescence method (×400). A, C, E, the cell morphology before immunofluorescence staining of cTnI, Desmin and Nkx2.5, respectively. B, D, F, the absence of expression of cTnI, Desmin and Nkx2.5, respectively, by immunofluorescence. (Color figure online)

