Fig. 2.
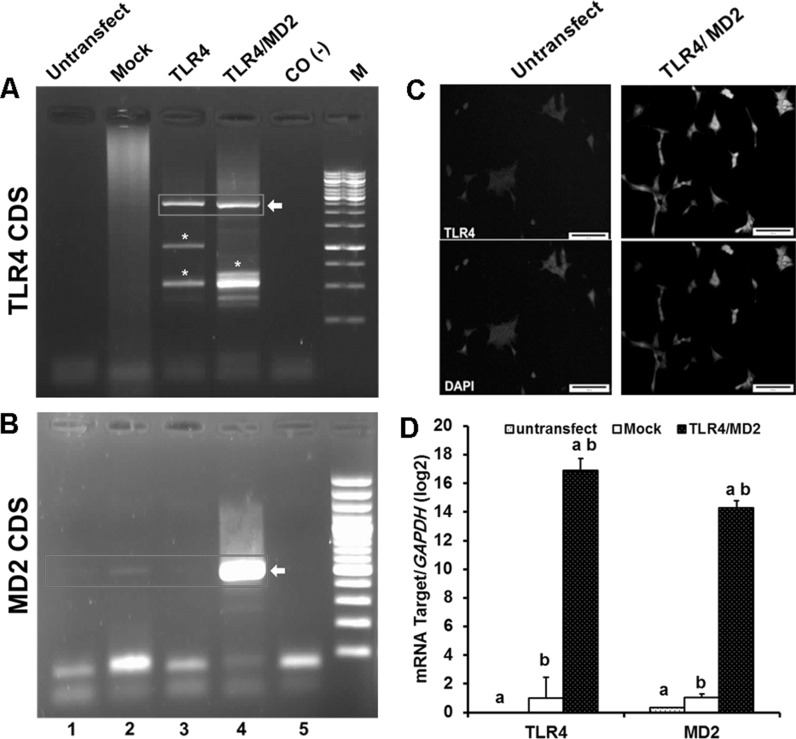
Characterization of stable HEK cell lines expressing MD2 and TLR4 proteins. RT-PCR analysis of HEK cell lines to identify the expression of TLR4 (A) and MD2 (B). The respective bands are shown in red box. Star represents the artificial nonspecific bands. M is DNA marker. Lanes 1–5 are referred as Untransfect: untransfected cell line, Mock: pBudCE4.1-TLR4-MD2 transformant cell line, TLR4: pBudCE4.1-TLR4 transformant cell line, TLR4/MD2: pBudCE4.1-TLR4-MD2 transformant cell line, and CO-: no template PCR reaction, respectively. C Immunofluorescence staining of TLR4 in HEK cells. The nuclei were counterstained with DAPI. Bar, 200 µm. D Relative expression levels of TLR4 and MD2 of untransfected cell line (untransfect) and pBudCE4.1(+) transformant cell line (Mock) and pBudCE4.1-TLR4-MD2 transformant cell line (TLR4/MD2) were compared. The number of independent repeats were 3 for each experiment (n = 3). Similar alphabets indicate significant difference between same samples at p < 0.001. (Color figure online)

