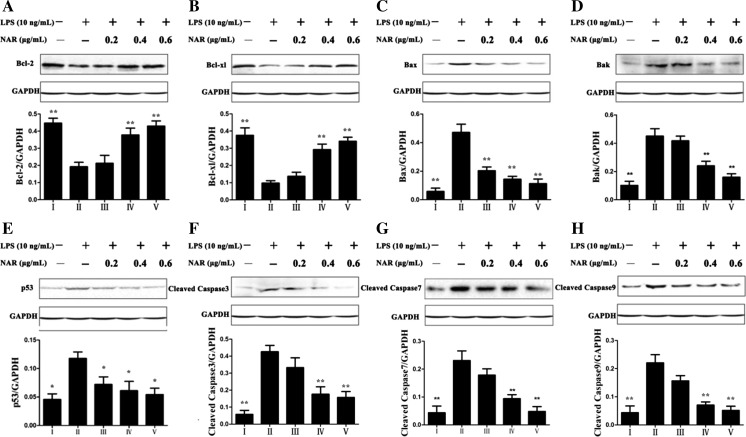
Fig. 8.
Effects of Nar on the protein expressions of Bcl-2 (a), Bcl-xl (b), Bax (c), Bak (d), p53 (e), Cleaved Caspase 3 (f), Cleaved Caspase 7 (g), Cleaved Caspase 9 (h). I: Control; II: Model; III: Nar (0.2 μg/mL); IV: Nar (0.4 μg/mL); V: Nar (0.6 μg/mL). *p < 0.05 and **p < 0.01, compared with model group

