. 2016 Jul 1;12(3):262–273. doi: 10.3988/jcn.2016.12.3.262

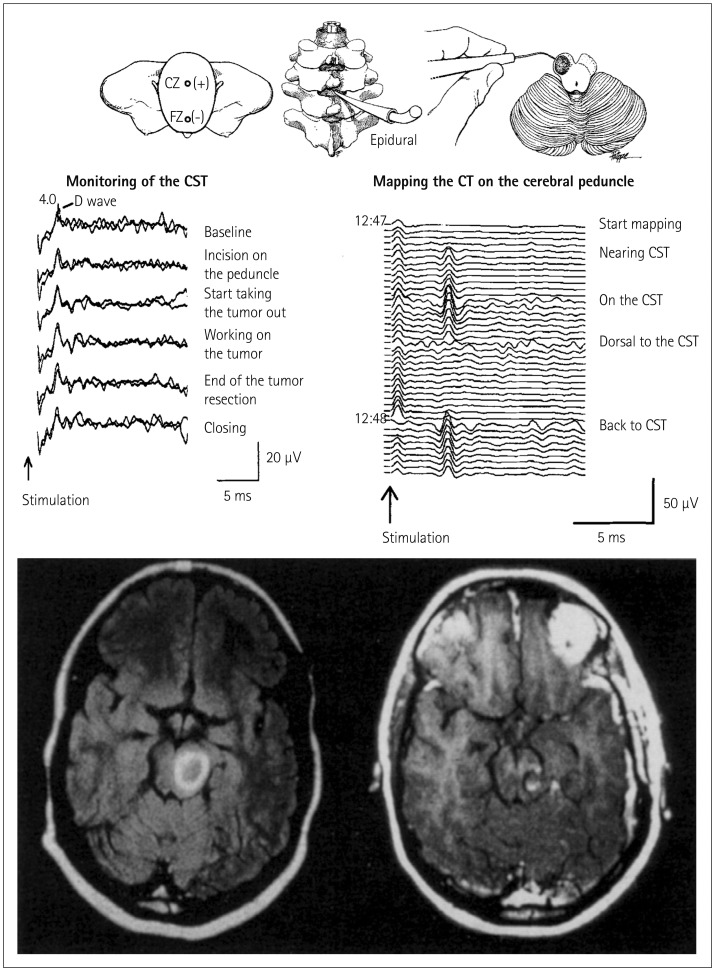
Fig. 3. Mapping and monitoring of the corticospinal tract (CST) during surgery for removing a left cerebral peduncle tumor in a 27-year-old woman. Bottom left: preoperative axial T1-weighted MR image with gadolinium enhancement revealed a high-intensity lesion in the left midbrain, dorsal to the cerebral peduncle. Bottom right: postoperative axial T1-weighted MR image with gadolinium enhancement showing that the tumor has been completely removed. The incision was performed in the area where no response to the stimulation of the cerebral peduncles was recorded. Top right: mapping of the CST on the cerebral peduncle is shown schematically. The cerebral peduncle is being mapped by a hand-held monopolar probe. As the probe neared the CST, responses were recorded from an epidural catheter (middle right). The responses were consistently reproducible. The stimulation intensity was 2 mA, the stimulation rate was 4 Hz, and four responses were averaged. Middle left: monitoring of the CST during tumor resection. After CST mapping, motor evoked potentials were continuously monitored by recording D-waves epidurally after transcranial electrical stimulation. The D-waves remained stable throughout the procedure and, the patient's preoperative motor function reappeared postoperatively. Adapted from Deletis V, et al., Operative Tech Neurosurg 2000;2:109-113, with permission from Elsevier.14.

Fig. 3