
FIGURE 2.
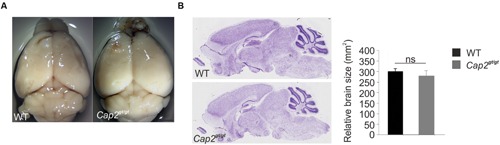
Morphology and anatomy of Cap2gt/gt brain. (A) Comparison of brains isolated from wild-type as well as from homozygous Cap2gt/gt mice does not reveal differences in the size of the brain (upper panel). Scale bar, 1 mm. (B) Nissl staining of sagittal sections and its graphical analysis from control and mutant brains (middle panel) does not show any significant difference in gross anatomy of brain WT: 300 ± 13 mm2, n = 10 sections from 3 mice; Cap2gt/gt: 280 ± 22 mm2, n = 10 sections from 3 mice, p > 0.05. Scale bar, 250 μm.