FIGURE 4.

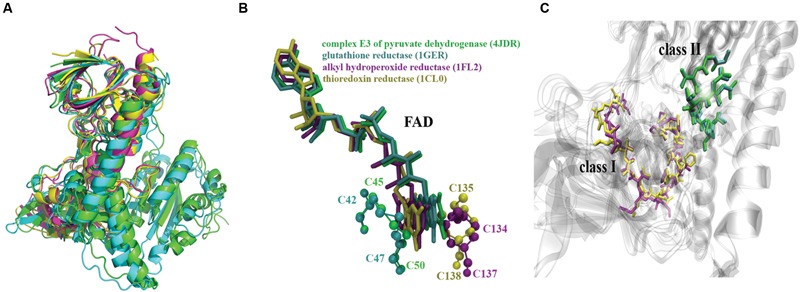
In silico analysis of E. coli TR flavoproteins. E3 (PDB_ID: 4JDR, green), GorA (PDB_ID: 1GER, cyan), AhpF (PDB_ID: 1FL2, purple), and TrxB (PDB_ID: 1CL0, yellow) flavoproteins are shown. (A) Structure alignment of these proteins showing their 3D structure available in PDB data base (Raptor X software; Wang S. et al., 2011). The global RMSD was 3.61 Å. (B) Structure alignment for the FAD molecule and representation of the interaction with the two catalytic cysteine residues of each protein. (C) Representation of the pyridine nucleotide-disulphide oxidoreductases class-I and class-II active sites.
