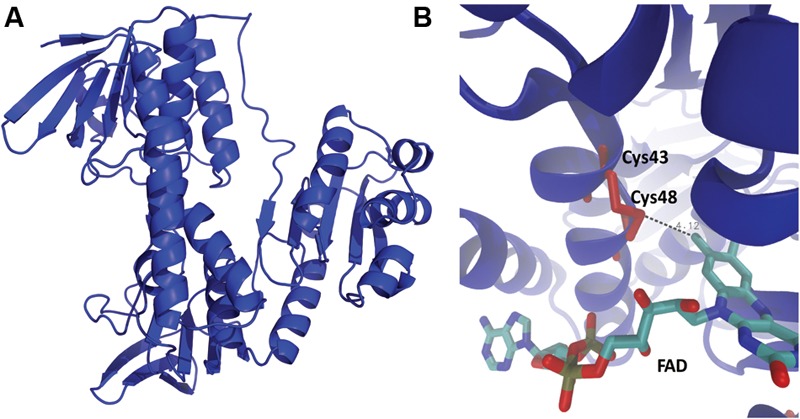
FIGURE 5.

Structural model of E. coli YkgC. (A) 3D structure of the protein was built through comparative modeling as described in Section “Materials and Methods.” (B) Protein-FAD complex was predicted by docking simulations. YkgC is shown in blue while Cys43 and Cys48 are depicted in red. The FAD molecule is shown by licorice representation.
