
Figure 1.
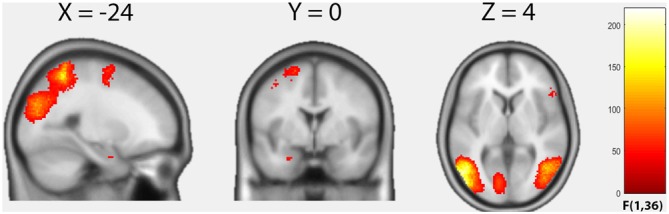
Results of the factorial analysis. Average effect of condition (F-contrast) “harmful movements > neutral movements”. Statistical maps are thresholded with p < 0.05, voxel-level family-wise error correction (FWE)-corrected.
Official websites use .gov
A
.gov website belongs to an official
government organization in the United States.
Secure .gov websites use HTTPS
A lock (
) or https:// means you've safely
connected to the .gov website. Share sensitive
information only on official, secure websites.
Results of the factorial analysis. Average effect of condition (F-contrast) “harmful movements > neutral movements”. Statistical maps are thresholded with p < 0.05, voxel-level family-wise error correction (FWE)-corrected.