Figure 4.

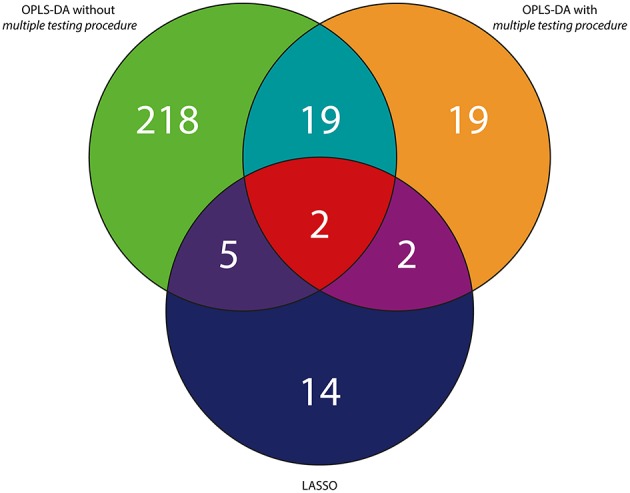
Venn diagram representing the summary of variables selected with the use of three different approaches exemplified by the UV scaling in case of OPLS-DA for the RH study.

Venn diagram representing the summary of variables selected with the use of three different approaches exemplified by the UV scaling in case of OPLS-DA for the RH study.