
Figure 5.
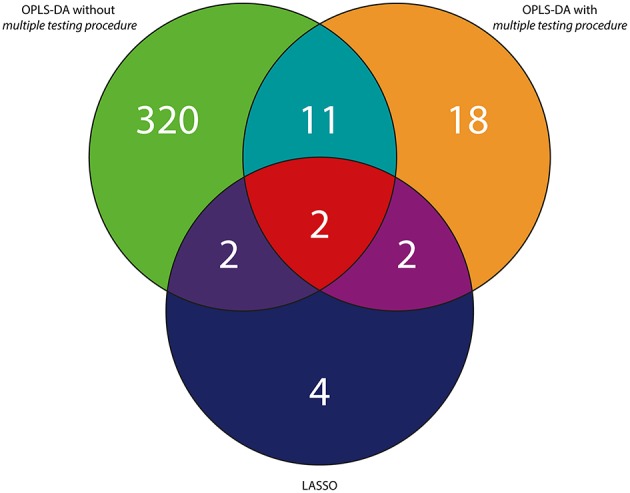
Venn diagram representing the summary of variables selected with the use of three different approaches exemplified by the UV scaling in case of OPLS-DA for the PH study.
Official websites use .gov
A
.gov website belongs to an official
government organization in the United States.
Secure .gov websites use HTTPS
A lock (
) or https:// means you've safely
connected to the .gov website. Share sensitive
information only on official, secure websites.
Venn diagram representing the summary of variables selected with the use of three different approaches exemplified by the UV scaling in case of OPLS-DA for the PH study.