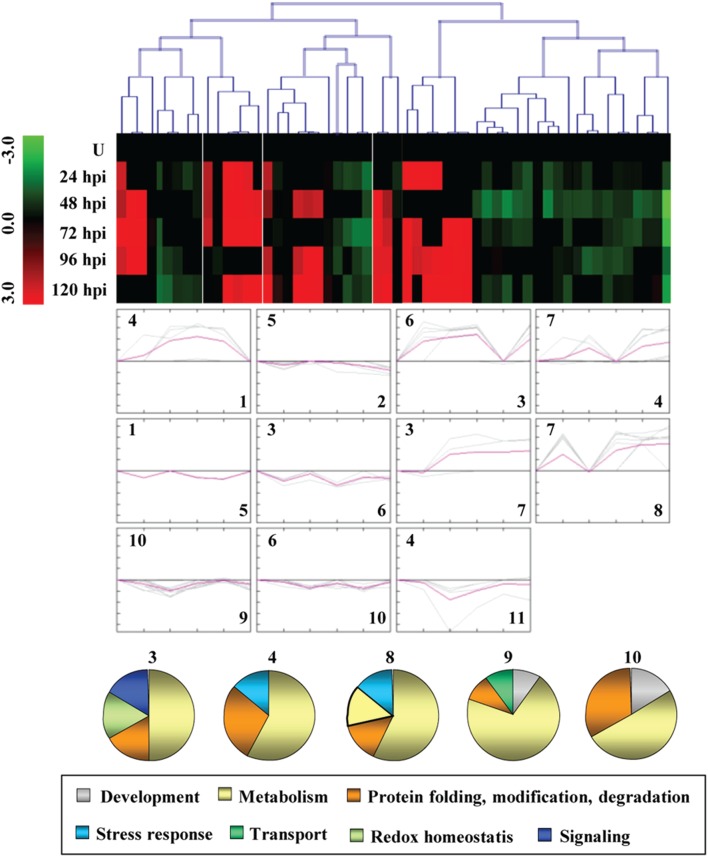
Figure 2.
Clusterogram of PSRPs. Fifty-six identified PSRPs were grouped into 11 clusters based on their expression pattern. The SOTA cluster tree is shown at the top, and the expression pattern in clusters are shown below. High (or low) abundance ranges from pale to saturated red (or green). U, unstressed.

