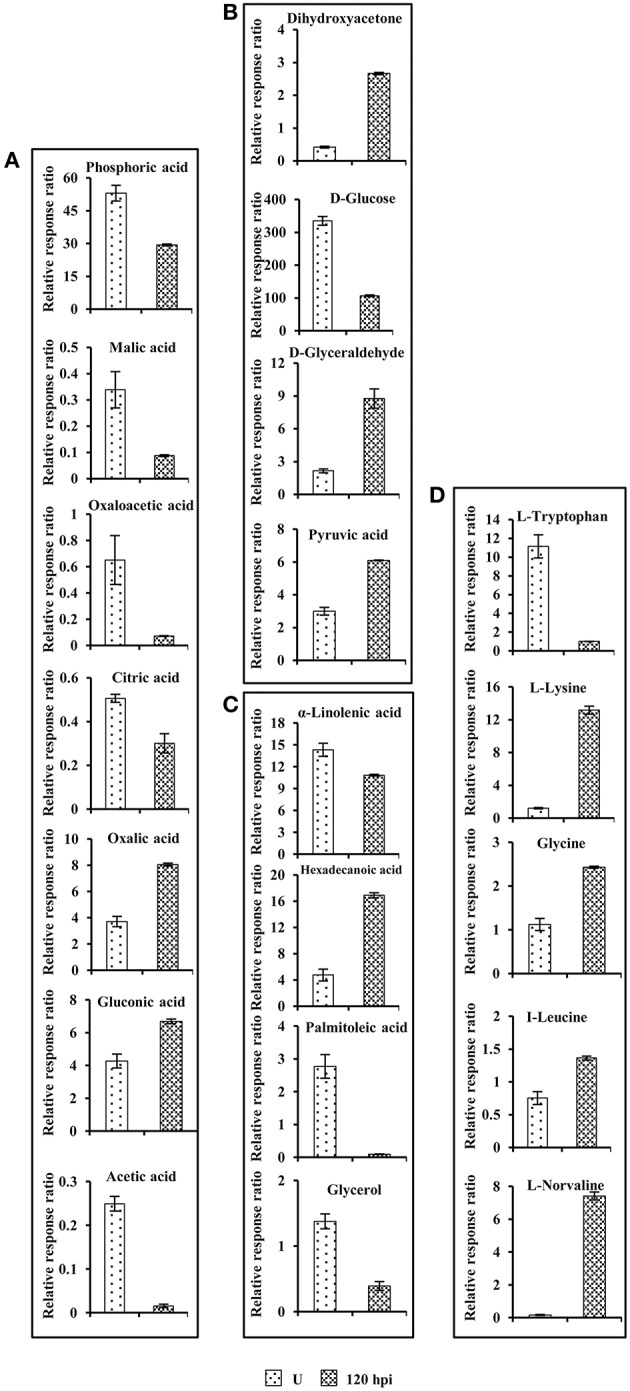
Figure 6.

Comparison of primary metabolite levels in unstressed tomato fruits with those in tomato fruits challenged with Sclerotinia rolfsii at 96 hpi. (A) Organic acids, (B) Carbohydrates, (C) Fatty acids and, (D) Aminoacids. Data are normalized to the mean response calculated for unstressed levels of each replicate (to allow comparison between replicates, individual values were normalized in same way). Values presented are the mean ± SD of four independent replicates.
