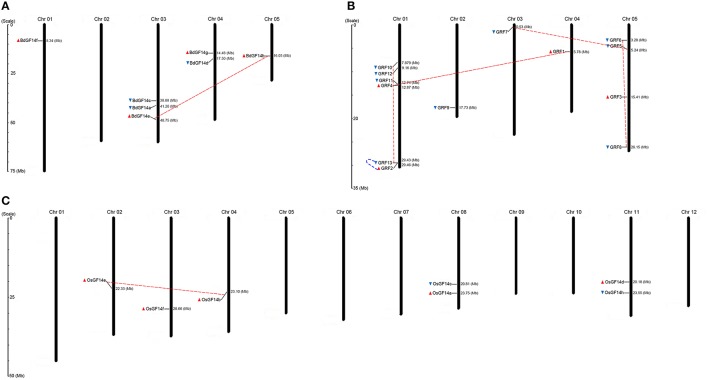
Figure 1.
Chromosomal distribution map of 14-3-3 genes in B. distachyon, Arabidopsis and rice. (A) B. distachyon. (B) Arabidopsis. (C) Rice. The chromosome numbers are indicated at the top of each bar, while the size of a chromosome is indicated by its relative length. The sea blue triangle and red triangle indicate the transcriptional direction of genes, sea blue (5′ to 3′) and red (3′ to 5′). The dashed lines with sea blue color represent tandem duplicated genes, whereas the dashed lines with red color represent segmentally duplicated genes.

