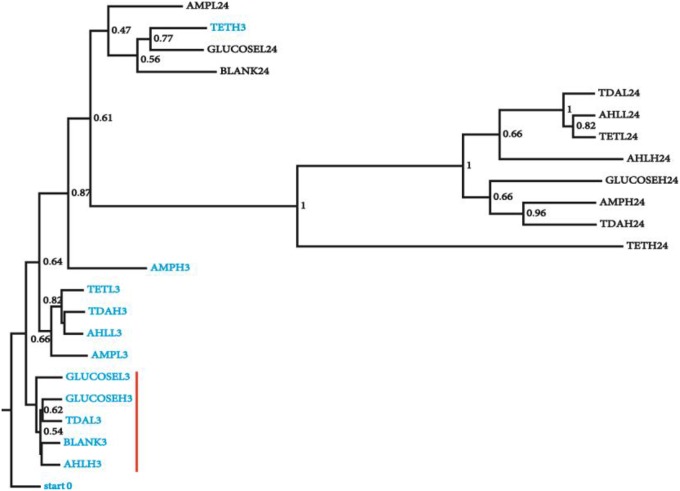
Figure 1.
Clustering of microbial diversity (β-diversity) of the starting microbiota with the samples from different chemical treatments at 3 and 24 h. Jackknifing of the UPGMA tree displays the robustness of clustering of the microbiota from the 3 h from 24 h samples. Bootstrap values are shown at the nodes of the tree, indicating percentage of jackknifed data supporting the node. Samples are named as following: chemical name (e.g., GLUCOSE), H/L (high/low concentration, e.g., L) and treatment time (e.g., 3), sample (GLUCOSEL3, treated with low amount of glucose for 3 h). Samples from 3 h (blue) treatment that were most similar to the starting microbiota are highlighted with a red vertical red bar.

