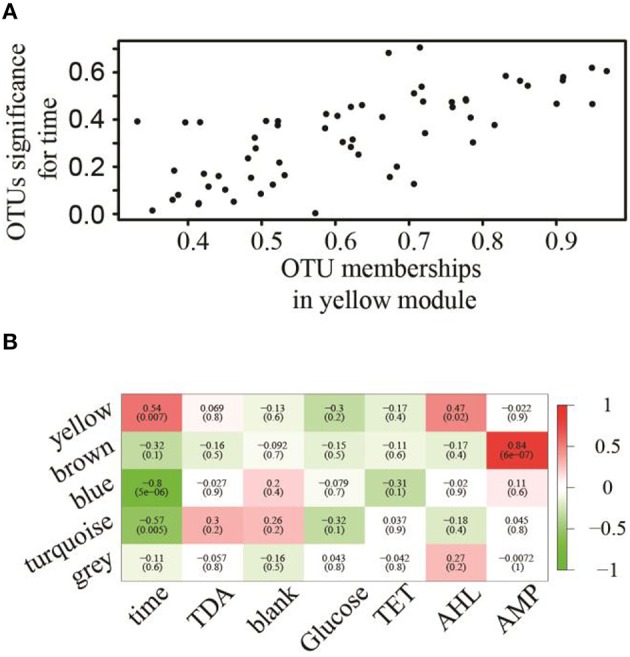
Figure 2.

Association of modules with external treatment factors. (A) OTUs associated with treatment–time with respect to their membership significance belonging to the yellow module. (B) Eigengene adjacencies heatmap identifying modules (row) that significantly associated with chemical treatments (column). Negative correlations (green) and positive correlations (red) indicate high adjacency (DiLeo et al., 2011), while white (zero) indicates low adjacency.
