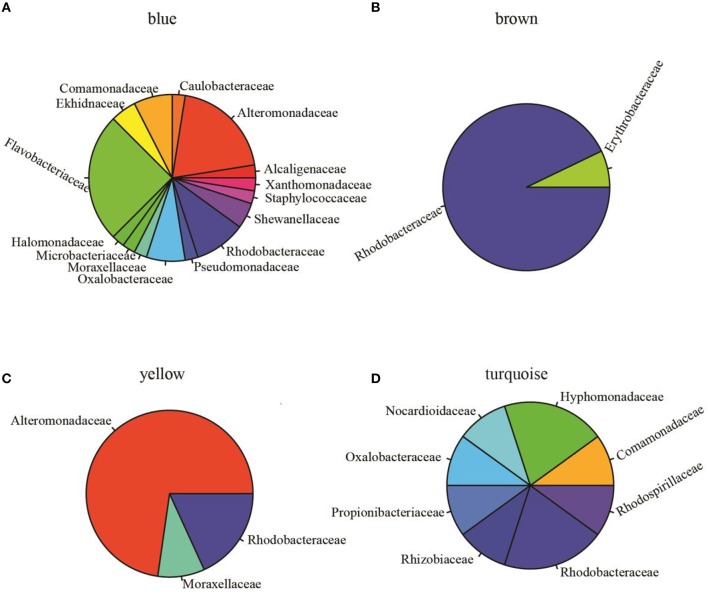
Figure 3.
Relative abundance of OTUs at the family level (indicated by different colors) in identified modules. (A) Blue module (total OTUs 40 annotated at family level, 127 OTUs unassigned at family level are not shown) was dominated by Flavobacteriaceae (25%, n = 10) and Alteromonadaceae (20%, n = 8). (B) Brown module (14 OTUs annotated, 63 unassigned) was dominated by Rhodobacteraceae (92%, n = 13). (C) Yellow module (total OTUs 11 annotated at family level) is comprised of Alteromonadaceae (72%, n = 8), Rhodobacteraceae (9.1%, n = 1), and Moraxellaceae (9.1%, n = 1). (D) Turquoise module (10 OTUs assigned to 8 families, 876 unassigned OTUs) is comprised of 8 families. These data showed that Rhodobacteraceae was significantly enriched in the brown module (one-sided Fisher's exact test, P < 0.0001) and Alteromonadaceae was significantly enriched in the yellow module (one-sided Fisher's exact test, P < 0.05).

