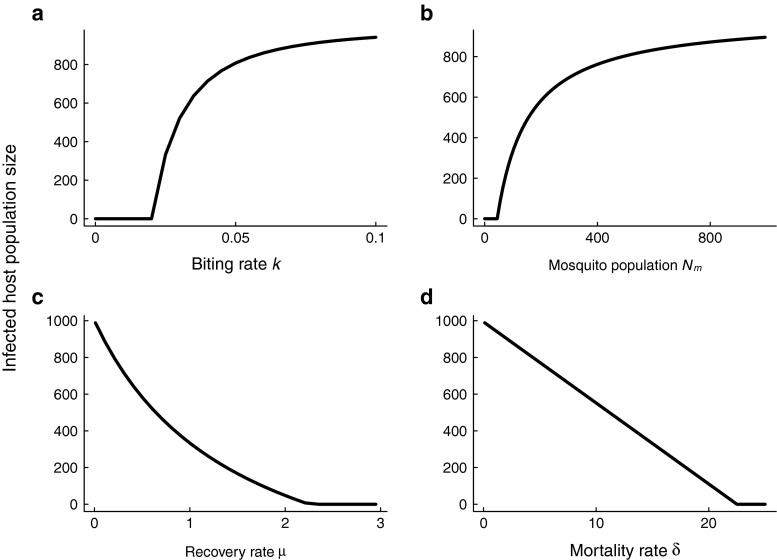
Fig. 1.
Bifurcation diagrams for the Ross-Macdonald model. The stable equilibrium branches of the transcritical bifurcation ( mean field theory) as a function of each parameter affected by control activities (per-capita biting rate, mosquito population abundance, per-capita recovery rate and per-capita mortality rate) are shown. Bifurcation diagrams were plotted using the parameters given in Table 1

