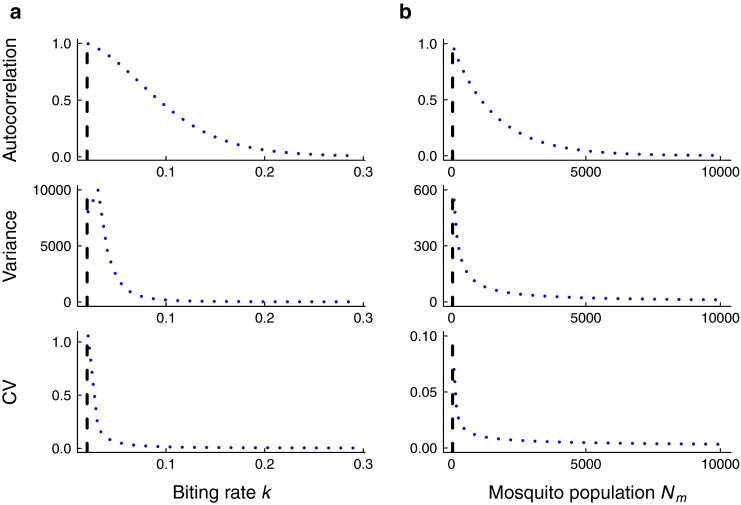
Fig. 3.

To obtain predictions for how the summary statistics behave as elimination is approached, mean leading indicators were calculated numerically using parameter values relevant for malaria (Table 1). The vertical dashed line in each figure indicates the threshold mosquito population abundance and threshold per-capita biting rate at R 0=1 respectively. a Lag-1 autocorrelation and coefficient of variation are predicted to increase as control measures impacting per-capita biting rate are applied but variance becomes non-monotonic close to the critical point. b Lag-1 autocorrelation, variance, and coefficient of variation are predicted to increase as control actitivies affecting mosquito population abundance are applied
