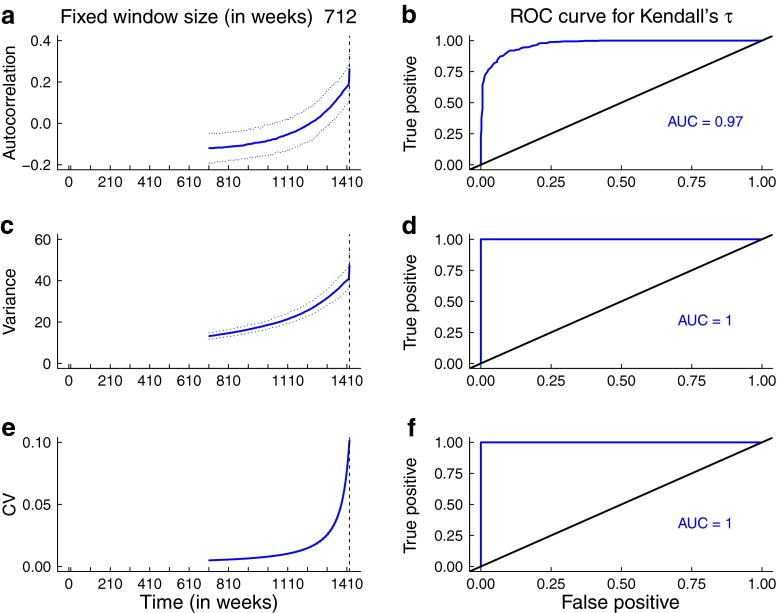
Fig. 6.
Simulation study results arising from reduction in mosquito population size. Note that the value of mosquito abundance is continuously changing over the 712-week window, at a rate of . Panels a, c, and e show the median statistics (thick lines) and 95 % prediction intervals (shaded regions). The dashed vertical line marks the time of the transcritical bifurcation. Theoretical predictions for the trends in each summary statistic are robust over a moving window. The AUCs are high, indicating it is possible to distinguish between the stationary system and one slowly approaching elimination. A bandwidth of 80 weeks was selected for Gaussian filtering

