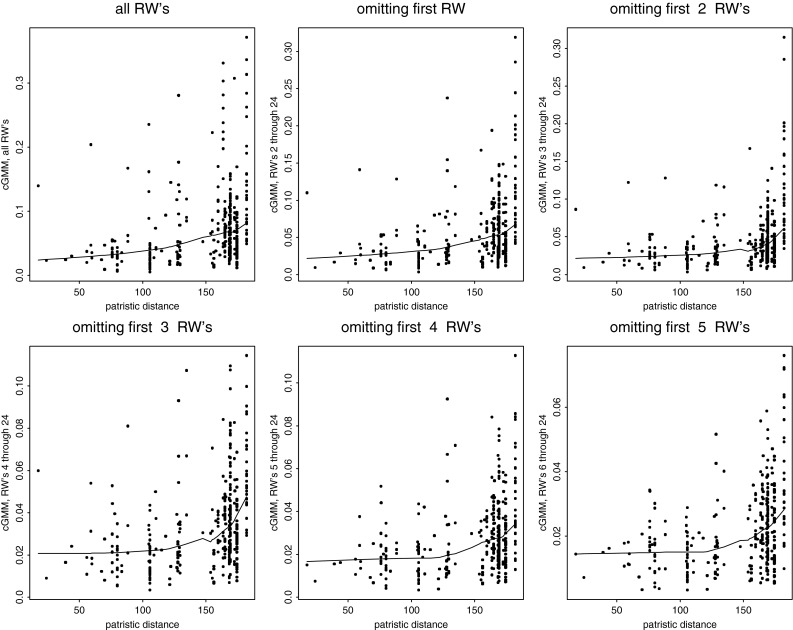
Fig. 10.

Approaching the neutral model of evolution. Scatters of locally computed Procrustes distance versus patristic distance for the full data set (upper left) and then versions omitting the first one, two, , five relative warps (RW’s) of the contrasts. Patristic distance (on the horizontal) has been restricted to less than 200 myr. The first scatterplot to show a linear upper border appears to be the fifth (center bottom panel), suggesting that there are three dimensions of functional morphology here that need to be partialled out, and also the specific derived features of Homo, before we can study anything important about evolution. cGMM: corrected GMM distance computation after recentering the J-matrix and (except at upper left) projecting out some of the relative warps. Lines lowess smooths of the dependence of the ordinate on the abscissa. Notice that the scales of the vertical axis differ from frame to frame (Color figure online)
