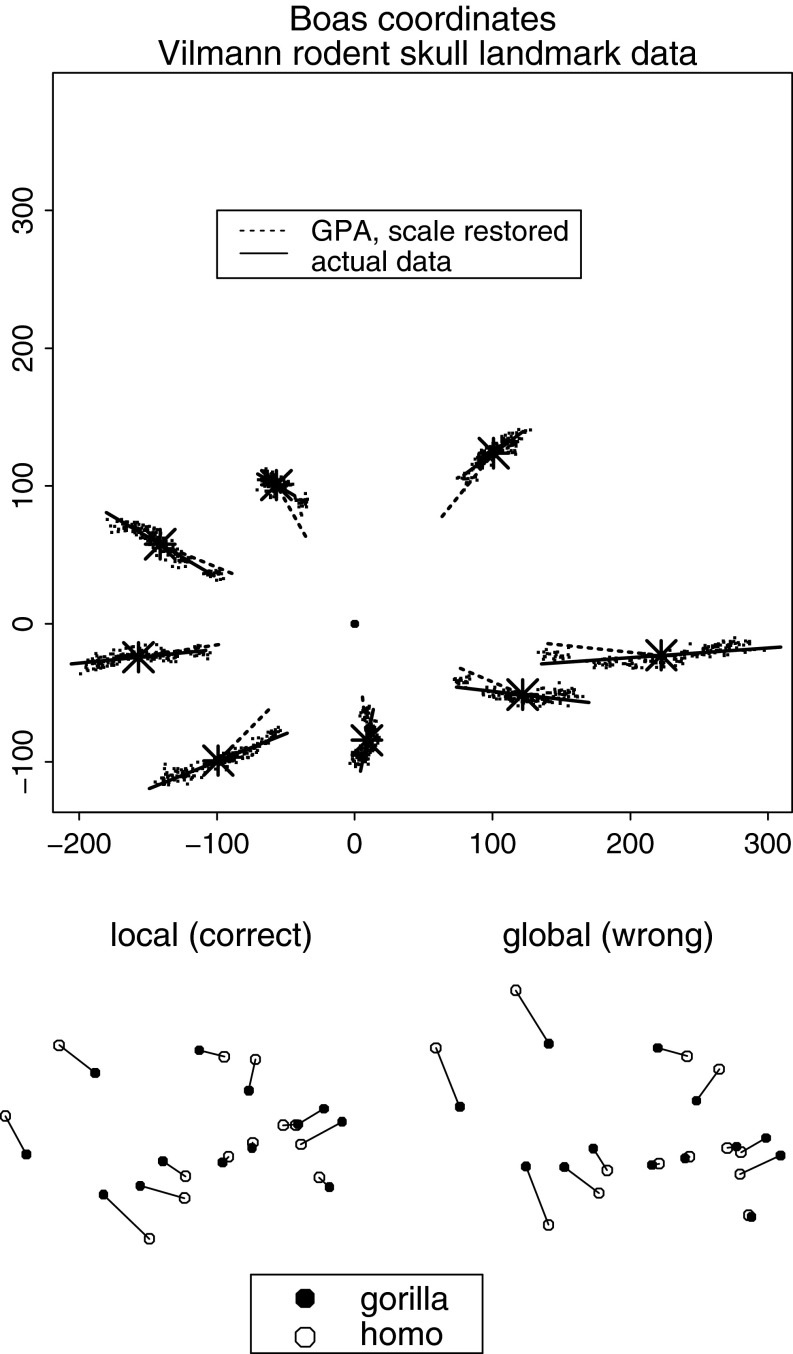
Fig. 4.
Two kinds of problems with the J-matrix. (above) Boas coordinates for the Vilmann rodent brain data set. To the extent the little regression vectors on centroid size (the measure of scale divided out in the Procrustes procedure) are not along the directions out of the centroid (the large filled dot) and proportional to displacement, the Procrustes procedure has misregistered these data. Big star symbols landmark mean locations after centering and rotation (the first three rows of the matrix J). Solid heavy lines regression predictions for two standard deviations of centroid size in either direction from its mean. Dashed heavy lines segments from the means about a third of the way back to the centroid. (below) In the method of contrasts, it makes quite a bit of difference whether the projection used to quantify contrast by contrast is based on the grand mean or instead on the pair of forms involved in the specific contrast. The relation between the 13-landmark configurations of Gorilla and Homo from the Marcus data set to be discussed in section “Modifying a Comparative Analysis of Mammalian Skulls” is clearly different depending on which reference mean is used to construct the projection matrix J. Left, the correct (local) computation. Right, the less thoughtful alternative based on the “mammalian archetype” in Fig. 8, wrongly indicating a much greater relative expansion of the braincase in Homo.

