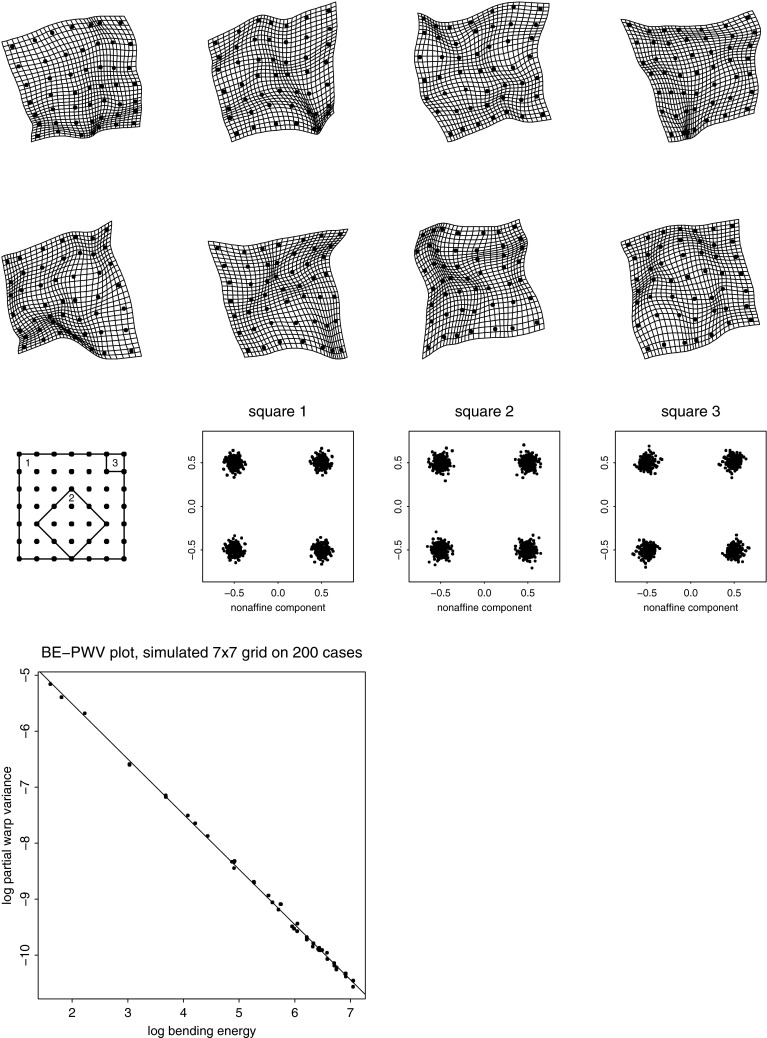
Fig. 6.

Deflated Procrustes analysis. (upper two rows) Eight instances from a sample of 200 from the deflated Procrustes distribution (Bookstein 2015a, b) on a grid. (third row) Nonuniform component of the shape distribution for three diverse squares as indicated in the key figure, far left. The theorem says these distributions must be identical. Notice how much less regionalized these grids are than the rightmost grid in Fig. 3. (bottom panel) For this distribution, the scatter of partial warp variance against partial warp bending energy, its BE–PWV plot, has a slope of . For this sample the computed slope is Empirical data sets often show slopes that differ from ; we will examine one of these in section “Extending the New Morphometric Models of Disorder to a Multiscale Regime: An Example from Entomology”
