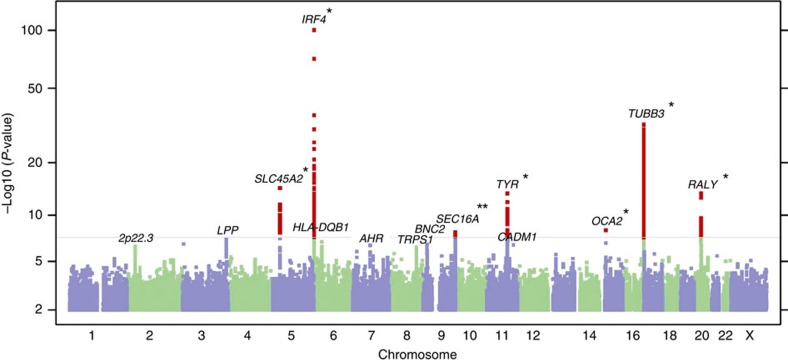
Figure 1. Manhattan plot of stage 1 GWAS analysis of SCC.
Total stage 1 GWAS analysis included 6,579 cases and 280,558 controls from the 23andMe cohort. The y axis represents log-scaled P-values. Loci with smallest P<10−5 (via logistic regression), of which there are 14 in total, are labelled with the name of the nearest gene. Positions with P<5 × 10⁻⁸ (genome-wide significance) are shown in red. Seven SCC susceptibility loci reached genome-wide significance in stage 1, including six previously reported pigmentation loci at 6p25.3 (IRF4), 5p13.2 (SLC45A2), 16q24.3 (MC1R), 11q14.3 (TYR), 20q11.22 (RALY-ASIP) and 15q13.1 (OCA2), which are highlighted by asterisks. The seventh susceptibility locus reaching significance in stage 1, 9q34.3 (SEC16A), is novel and not pigmentation related (marked by a double asterisk). Three additional novel susceptibility loci, 2p22.3, 7p21.1 (AHR) and 11q23.3 (CADM1-BUD13), reached genome-wide significance in the overall meta-analysis, as did the previously reported locus 9p22.2 (BNC2-CNTLN) (Table 2). The remaining three loci in the figure, 3q28 (LPP), 6p21.3 (HLA-DQB1) and 8q23.3 (TRPS1), had P<10−5 in stage 1 but did not reach genome-wide significance in the meta-analysis.

