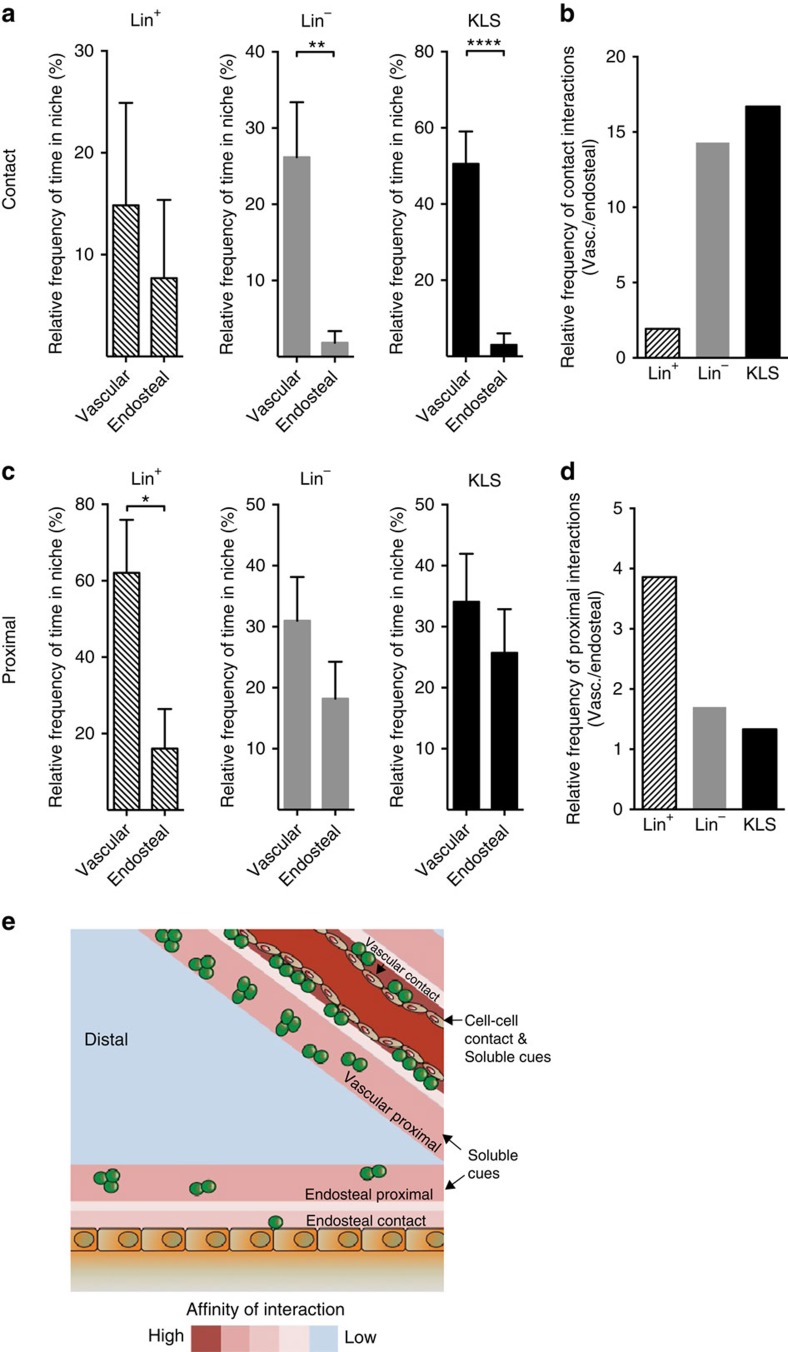
Figure 5. Comparative associations of haematopoietic cells with vascular and endosteal regions.
(a) The relative fraction of time (shown as per cent) in contact with the vascular or endosteal niche. **P=0.0016 for Lin−. ****P<0.0001 for KLS by Student's t-test. Data represented as mean+s.e.m. (b) The relative contact frequency (vasculature/endosteal) of KLS (black), Lin− (grey) and Lin+ (solid hatched line) cells. (c) The relative fraction of time in proximal interactions with the vascular or endosteal niche. *P=0.0137 for Lin+ by Student's t-test. Data represented as mean+s.e.m. (d) The relative proximal frequency (vascular/endosteal) of KLS (black), Lin− (grey) and Lin+ (solid hatched line) cells. (e) Model showing microenvironmental regions enriched for progenitor cell (Lin−) associations in homeostasis as an example. Cells are preferentially in contact with or proximal to the vascular niche but mostly proximal to, rather than in contact with, the endosteal region. Warmer colours (red) identify areas with a high probability of associations and cooler colours (blue) identify areas with a low probability of associations.

