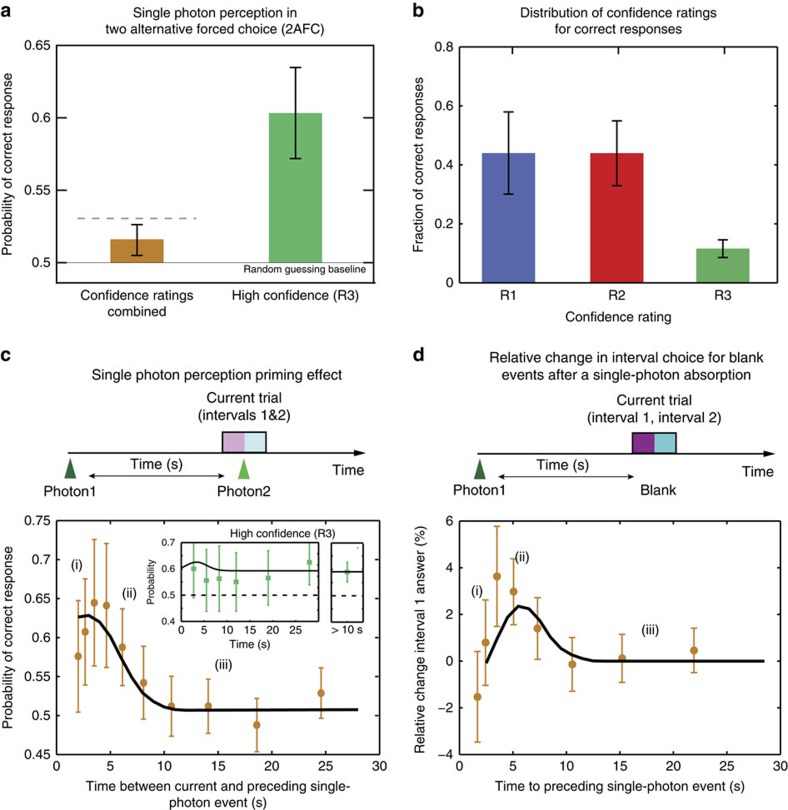
Figure 2. Single-photon perception and photon-induced temporal modulation of detection probability.
(a) Perception of a single photon. Probability of providing the correct response in 2AFC trials for all post-selected single-photon events (brown, n=2,420) and high-confidence R3 responses (green, n=242) averaged across all subjects. 0.5 is the baseline and corresponds to random guessing. The horizontal dashed line indicates the upper theoretical limit of performance of an ideal detector operating at the physiological level of detection efficiency in the absence of additional noise and using the framework of signal detection theory (Supplementary Note 1). (b) Distribution of different confidence ratings for post-selected single-photon events in which the stimulus was correctly identified. (c) Probability of correct response as a function of the time to the preceding single-photon event, data averaged across subjects and ratings (n=2,420). The probability of correct response for events combined at times between 0 and 10 s is significantly higher than for events at longer times (>10 s, P=0.02). 0.5 is the baseline and corresponds to random guessing. (i–iii): three temporal regions corresponding to different scenarios of the model in Fig. 3a. Solid line is a fit to the model illustrated in Fig. 3a and discussed in Supplementary Note 3. Inset shows the same data but for the high-confidence rating only (n=242). The additional panel on the right is the probability of correct response for all combined R3 events outside of the temporally enhanced detectability region (>10 s). (d) Relative change in interval 1 responses for blank trials, that is, containing no photons (n=28,233) as a function of time to the preceding single-photon event. The data are averaged across subjects and ratings. (i–iii): Three temporal regions corresponding to different scenarios in Fig. 3b. Combined data in the range 3–6 s is significantly above 0% (P=0.007). The solid line is a fit to the model illustrated in Fig. 3b (χ2=2.7) and discussed in Supplementary Note 3. In a–d error bars denote s.e.m.

