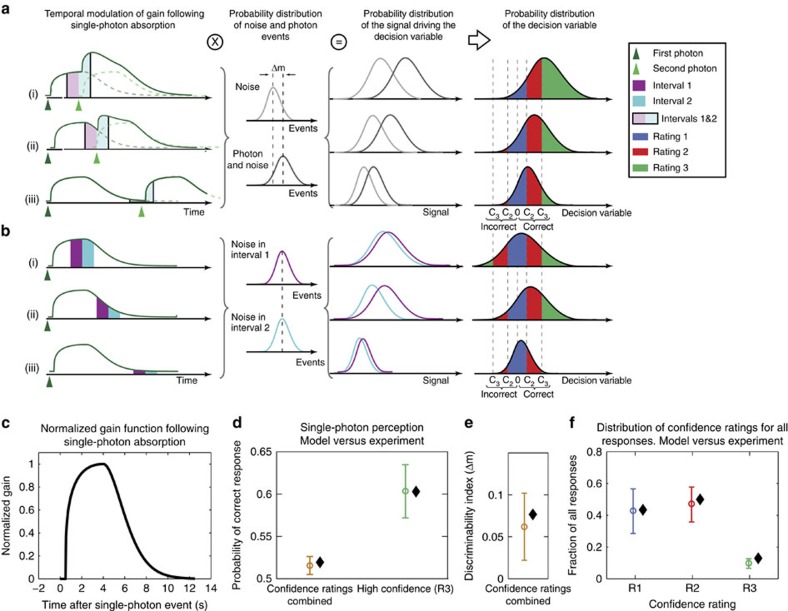
Figure 3. Model for photon-induced priming of single-photon detection probability.
(a,b) First column: temporal modulation of the effective gain following the absorption of two (a) or one (b) photons separated by three different time delays, corresponding to the respectively regions denoted in Fig. 2c,d (i–iii). Second column: probability distribution for photon plus photon-like noise events and photon-like noise events only during intervals 1 and 2. Δm indicates the discriminability index, a measure for the separation between the noise and the signal plus noise distributions (see Supplementary Note 2 for details). Third column: accumulated signal driving the decision variable, that is, the product of the gain (left) and the probability distribution of the photon and photon-like noise events (a) or noise events only (b) for the two intervals of a trial. Fourth column: the decision variable, which is proportional to the difference between the signal distributions. The decision criteria C2 and C3 separate the decision variable into low, medium and high-confidence ratings (Supplementary Note 3). Rows (i–iii) refer to the three temporal regions shown in Fig. 2c. The distributions shown are cartoons. For the actual parameter values refer to Supplementary Note 3. (c) Normalized temporal profile of the gain following a photon absorption at t=0. Kernel obtained by simultaneously fitting data in Fig. 2c,d to the model (Supplementary Note 3). (d) Probability of correct response in all single-photon experiments (circles with error bars – same data as in Fig. 2a) and fit to the model including decision criteria for high-confidence R3 (black diamonds). 0.5 is the baseline in 2AFC and corresponds to random guessing. Experimental data and fits are separated horizontally for clarity. (e) Discriminability index (Δm; see Supplementary Note 2) based on all single-photon experiments (circle with error bar) and fit to the model (black diamonds). (f) Distribution of all answers for post-selected single-photon events for different confidence ratings (same data as in Fig. 2b, circles with error bars) and the fit to the model including decision criteria (black diamonds). Goodness of the fit for the data combined in d,f is χ2=0.012.

