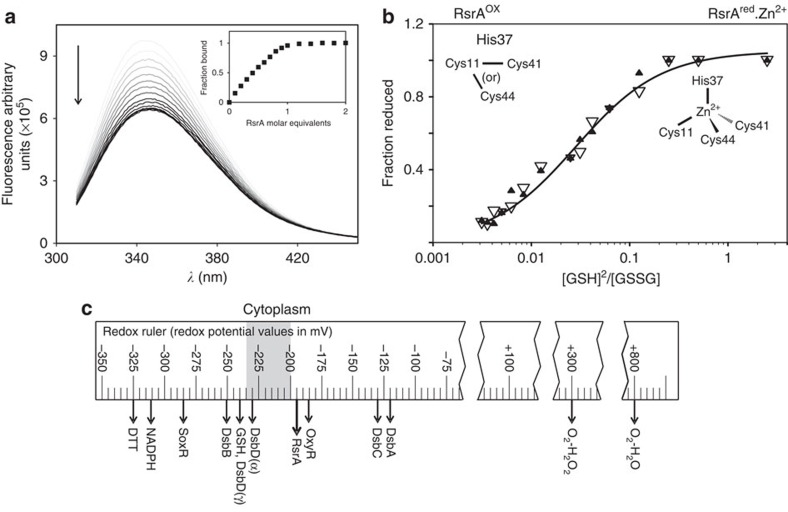
Figure 2. Redox potential of the RsrAred.Zn2+–σR complex.
(a) RsrAred.Zn2+ binding to σR monitored by intrinsic tryptophan emission fluorescence spectroscopy. Figure shows emission spectra (λex 295 nm) of σR at different RsrAred.Zn2+ concentrations collected at 25 °C in 50 mM Tris (pH 7.5) buffer, 100 mM NaCl and 2 mM DTT. For clarity, traces are coloured with incrementally darker tone of grey for increasing RsrA concentration. Inset figure shows fraction of σR in complex as measured by the change in fluorescence intensity at 343 nm with increasing RsrAred.Zn2+ concentration. Data show stoichiometric binding of RsrAred.Zn2+ to σR. (b) Redox potential of RsrAred.Zn2+ in complex with σR complex relative to a redox couple of reduced/oxidized glutathione. The degree of oxidation was measured by the change in tryptophan emission fluorescence of σR as the complex dissociates (open triangles) and by the release of Zn2+ using the PAR assay (filled triangles). Both sets of data were fitted to the Nernst equation to determine the redox potential of the RsrAred-Zn2+–σR complex as −193.04±2.01 mV. Experiments were conducted in 50 mM Tris (pH 7.5) buffer containing 100 mM NaCl and at 25 °C. (c) Redox ruler showing the redox potentials of selected proteins and small molecules. Figure adapted from ref. 27. The estimated redox potential of the bacterial cytoplasm is indicated in grey.

