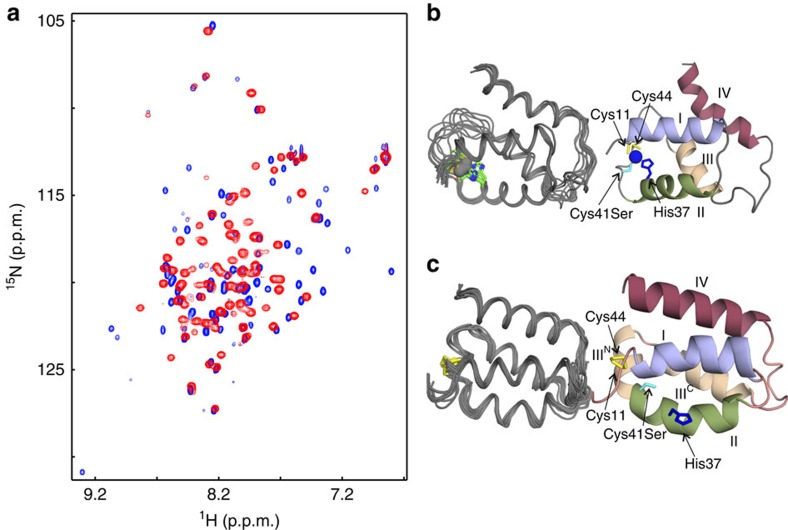
Figure 6. Solution structures of RsrAred.Zn2+ and RsrAox.
(a) Comparison of 1H-15N-HSQC spectra of reduced RsrA* Cys41Ser (RsrAred-Zn2+, blue peaks), in 20 mM Tris buffer (pH 7.1) containing 5 mM DTT and 2 mM ZnCl2, with RsrAox (red peaks), which is the same protein in the same buffer but in the absence of reductant and metal ions. (b) Overlay of the 10 lowest-energy structures for RsrAred-Zn2+ (residues Glu8–Gln86; left-hand figure) and a ribbon diagram of the lowest-energy structure (right-hand figure), showing the location of the zinc-binding residues (His37, blue; Cys41Ser, cyan; Cys11 and Cys44, yellow) and the zinc atom (blue). (c) Overlay of the 10 lowest-energy structures for RsrAox (residues Glu8–Gln86; left-hand figure) and a ribbon diagram of the lowest-energy structure (right-hand figure), showing the location of the disulfide bond and disruption of the metal site following oxidation (residues and helices are coloured as in b).

