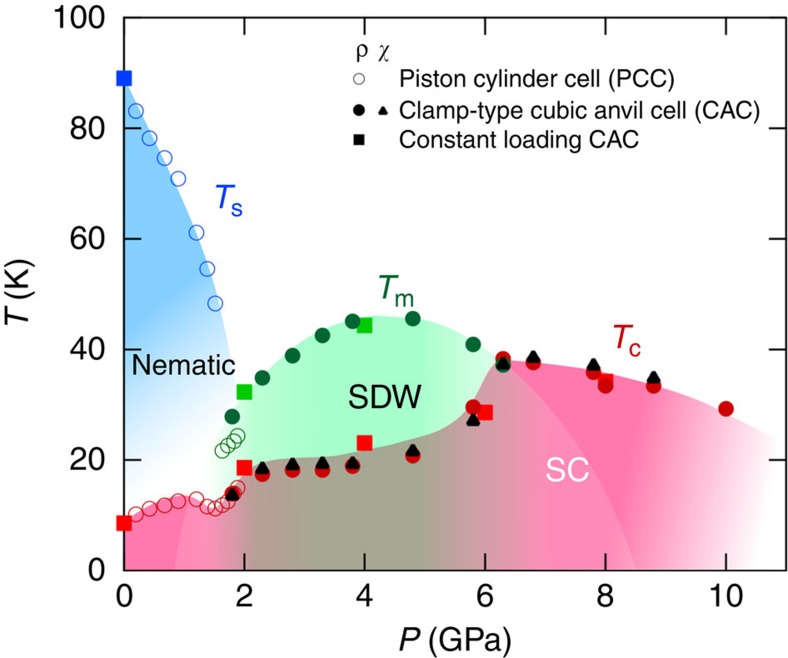
Figure 1. Temperature–pressure phase diagram of bulk FeSe.
The structural (Ts, blue), magnetic (Tm, green), and superconducting transition temperatures (Tc, red and black) as a function of hydrostatic pressure in high-quality single crystals determined by anomalies in resistivity ρ(T) measured in the PCC (open circles), clamp-type CAC (closed circles), and constant-loading type CAC (closed squares). Tc values determined from the ac magnetic susceptibility (χ(T)) measurements in the clamp-type CAC are also shown (solid triangles). The magnetic phase is most likely a spin density wave (SDW) phase. Colour shades for the nematic, SDW, and superconducting (SC) states are guides to the eyes.

