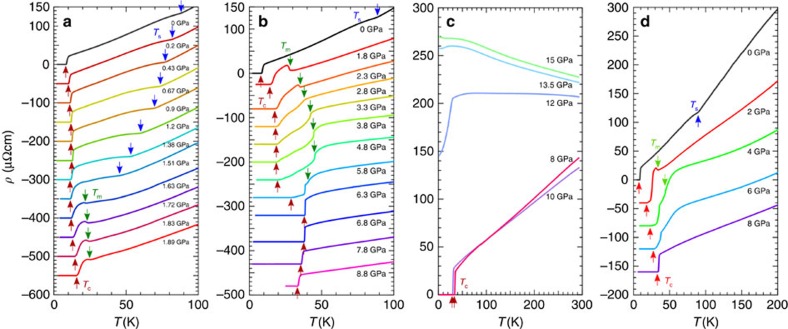
Figure 2. Temperature dependence of resistivity in FeSe single crystals under high pressure.
(a) ρ(T) curves below 100 K at different pressures up to ∼1.9 GPa measured in the self-clamped PCC. (b) Data up to ∼8.8 GPa measured in the self-clamped CAC. (c) Data up to ∼15 GPa measured in the smaller self-clamped CAC. (d) ρ(T) curves below 200 K up to 8 GPa measured in the constant-loading CAC. Except for (c) the data are vertically shifted for clarity. The resistive anomalies at transition temperatures Ts, Tm, and Tc are indicated by the arrows.

