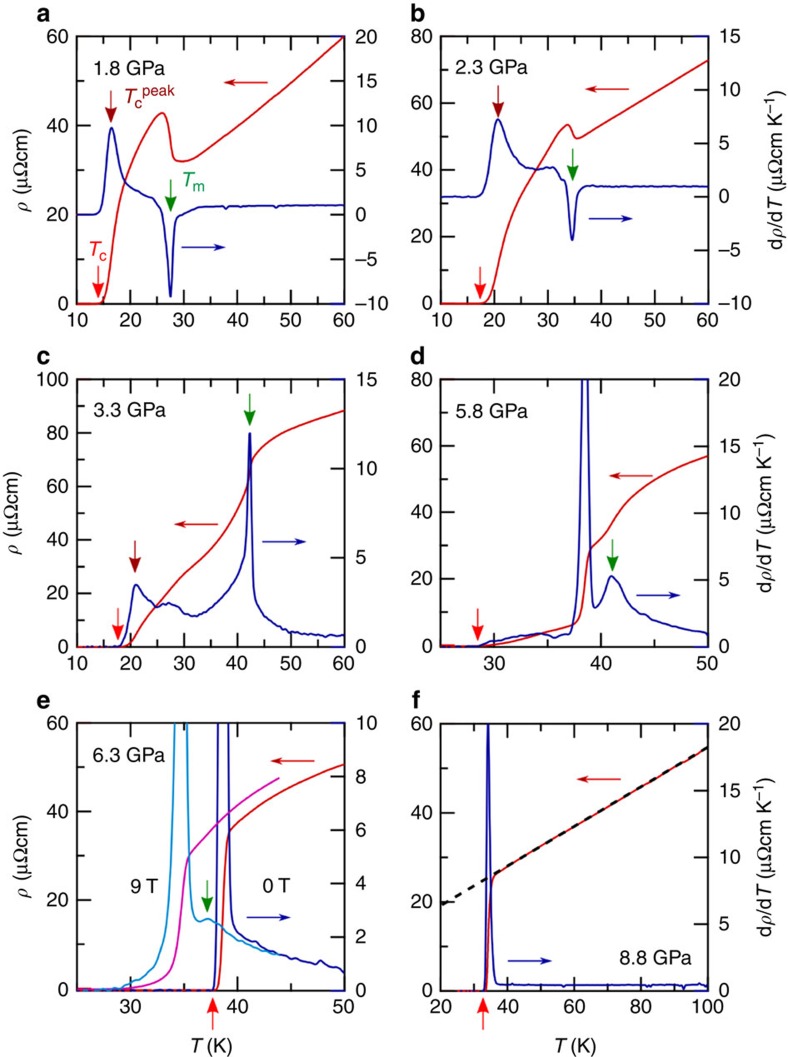
Figure 3. Determination of magnetic and superconducting transition temperatures from the resistivity curves under high pressure.
(a–f) Temperature dependence of resistivity ρ(T) (left axis) and temperature derivative of resistivity dρ/dT(T) (right axis) at low temperatures. The temperature at the maximum slope of superconducting transition is defined as  and the zero resistivity temperature as Tc. The magnetic transition temperature Tm is determined by the dip or peak in dρ/dT(T). At 6.3 GPa, the data at 9 T is also shown where Tm anomaly appears when the superconducting transition is suppressed to a lower temperature (e). At 8.8 GPa, the normal-state resistivity can be fitted to a T-linear dependence (dashed line in (f)).

