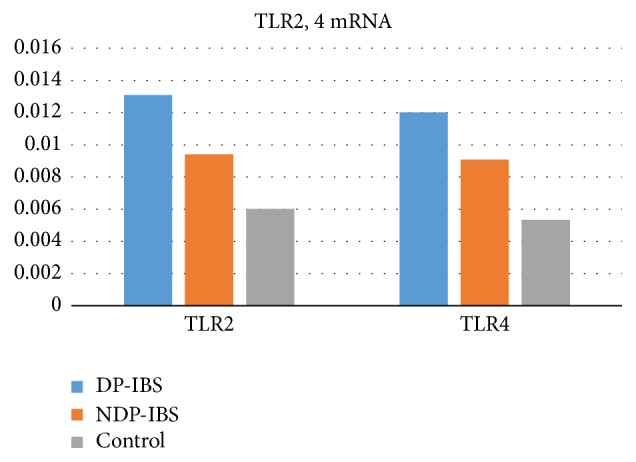
Figure 3.

TLR2 and TLR4 mRNA expressions in DP-IBS, NDP-IBS, and the control group (0.013 ± 0.002, 0.009 ± 0.003, and 0.006 ± 0.002, resp., F = 5.018, P = 0.008; 0.012 ± 0.002, 0.009 ± 0.001, and 0.005 ± 0.001, resp., F = 12.015, P < 0.01). The TLR2 mRNA levels in DP-IBS and NDP-IBS patients were significantly higher than those in the control group, and those in DP-IBS patients were significantly higher than those in NDP-IBS patients (P < 0.05). TLR4 mRNA levels in DP-IBS and NDP-IBS patients were significantly higher than those in the control group, and those in DP-IBS patients were significantly higher than those of NDP-IBS patients (P < 0.05).
