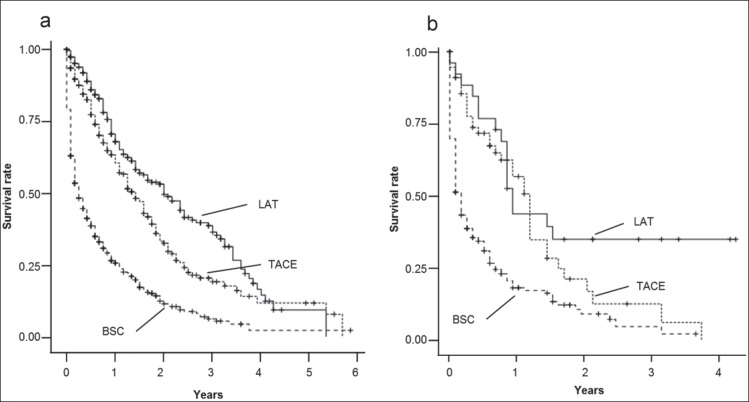
Fig. 2.
a A comparison of OS among the BSC, LAT, and TACE groups with C-P scores of 10 or 11. Each Kaplan-Meier survival curve represents the OS of patients who underwent LAT, TACE, and BSC. The patients who underwent LAT or TACE had significantly longer OS than patients who received BSC (p<0.0001). b A comparison of OS among the BSC, LAT, and TACE groups with C-P scores of 12-15. The Kaplan-Meier survival curves indicate that patients who underwent LAT or TACE had significantly longer OS than patients who received BSC (p<0.0001).

