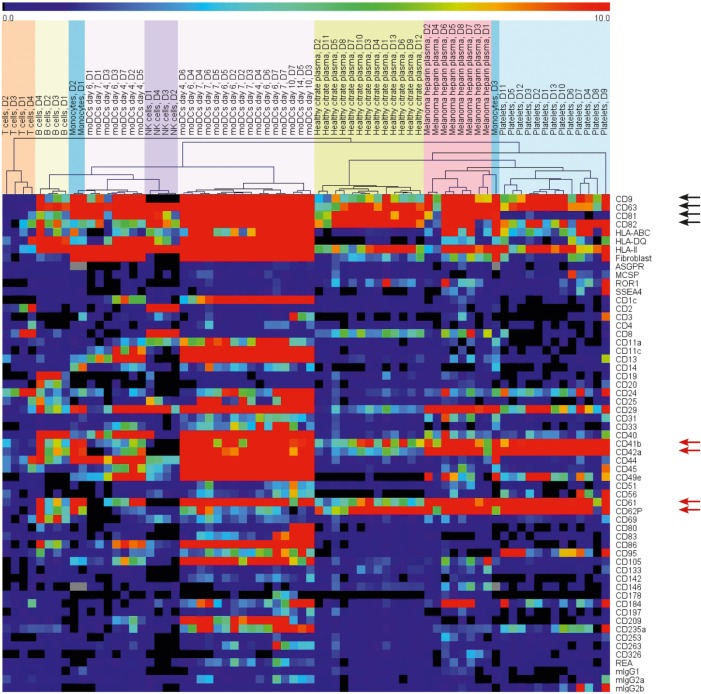
Figure 3.
Heat map depicting the surface protein profiles of EVs from different primary blood cells and plasma of healthy donors and melanoma patients. Background corrected signals were used. The range indicator is limited to signals below 10 MFI to draw the attention to the presence or absence of signals instead of variations of strong signals.

