
Figure 4. The relative fitness cost (Cr) of mNSC ablation at different population growth rates (r) for each male exposure treatment.
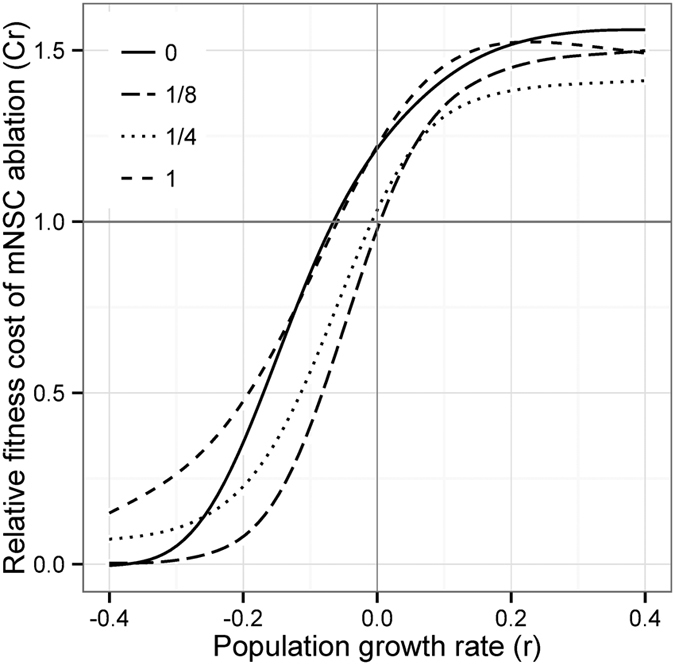
The grey horizontal line identifies relative fitness of 1; values above one indicate a fitness cost to mNSC ablation and values below one indicate a fitness benefit. The grey vertical line identifies a stable population with no population growth (r = 0). See Table S1 for the number of vials retained for offspring count every 4 days that were used for generating the relative fitness cost measures.