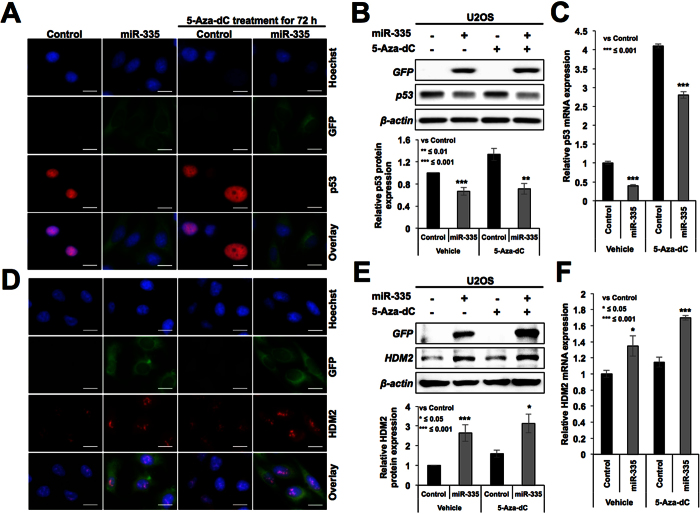
Figure 5. miR-335 overexpressing cells showed compromised expression of p53.
Immunostaining (A) Western blotting (B) and qPCR (C) analyses for p53 showed decreased level of expression in miR-335 overexpressing cells. The transfected cells showed higher level of expression of HDM2; immunostaining (D) Western blotting (E) and qPCR (F) data are shown. Scale bars represent 20 μm.

