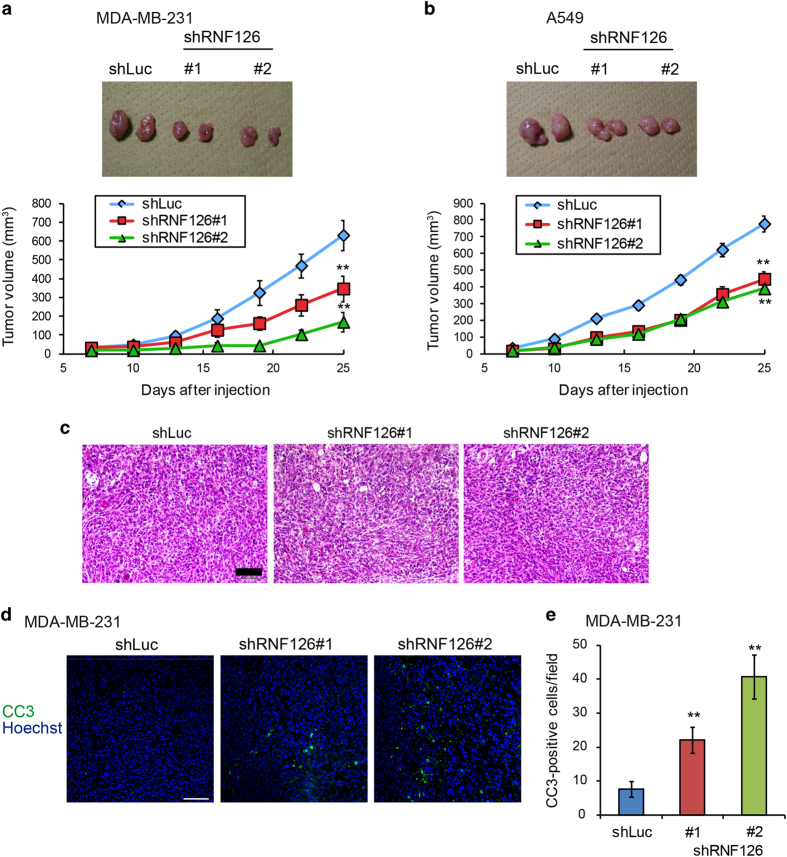
Figure 2.
RNF126 promotes tumorigenicity. (a and b) Representative photographs (upper panel; day 25) and rate of growth (lower panel) following subcutaneous implantation of control and RNF126-depleted MDA-MB-231 (a) and A549 cells (b) in immunodeficient mice. (c) Hematoxylin and eosin staining of tumor tissues derived from control and RNF126-depleted MDA-MB-231 cells at day 25. Scale bar=100 μm. (d) Immunostaining of cleaved caspase-3 (CC3) in tumor tissues of control and RNF126-depleted MDA-MB-231 cells at day 25. Bar=200 μm. (e) CC3-positive cells in tumor sections in (d) were counted. In (a, b and e), the error bars indicate the s.e.m.; n=8 from two independent experiments (n=4 and n=4, respectively); the data shown were analyzed using the Mann–Whitney U-test. **P<0.01.

