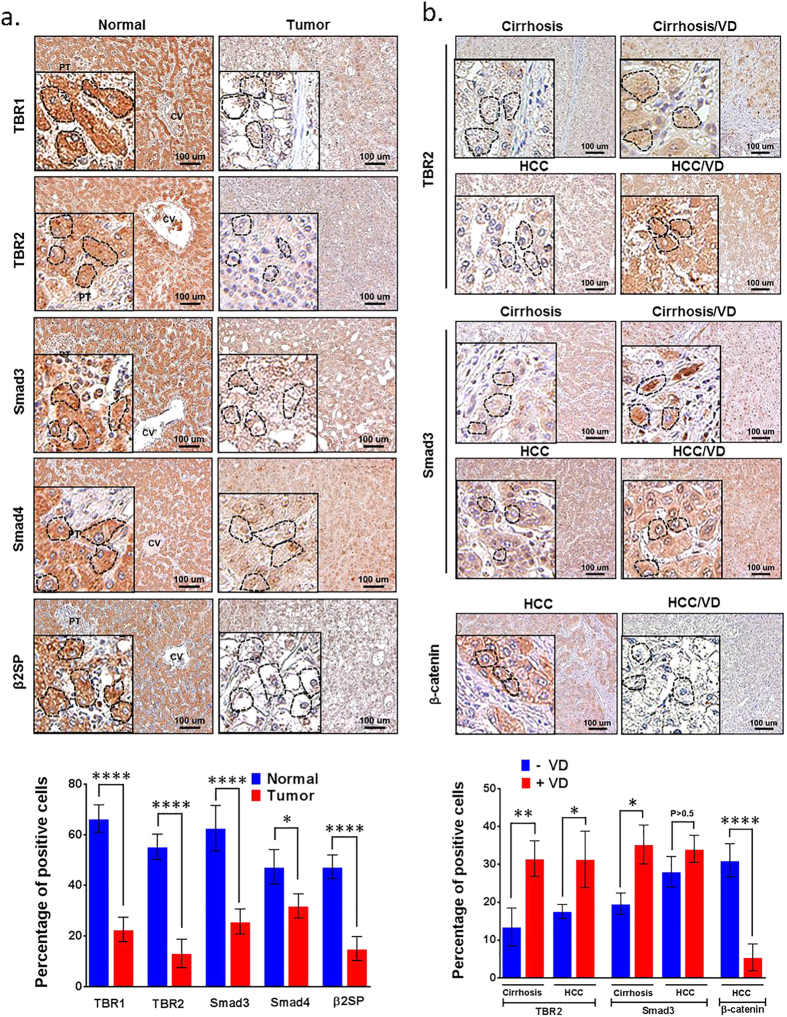
Figure 6. High-dose VD treatment induces Smad3, β2SP and TBR2 expression while suppressing β-catenin in the liver of cirrhotic or hepatocellular cancer patients.
(a) Patients were treated with or without VD (50,000 IU / week) for 26 weeks. IHC staining for TBR1, TBR2, β2SP, Smad3, and Smad4 were performed in human tissue specimens of normal liver (n = 12) and HCC (n = 11). Quantification of IHC staining is shown in the bar graph (lower panel). (b) IHC staining for TBR2, Smad3 and β-catenin were performed in human liver tissue specimens of cirrhosis (n = 10), cirrhosis with VD-treatment (n = 7), HCC (n = 11), and HCC with VD-treatment (n = 12). Quantification of IHC staining is shown in the bar graph (lower panel). Magnification ×20; the insets magnification ×60. Scale bar, 100 μm. Circles indicate representative hepatocytes. Error bars are shown as standard deviations. (*P < 0.01, **P < 0.001, ****P < 0.0001, Student’s t-test).

