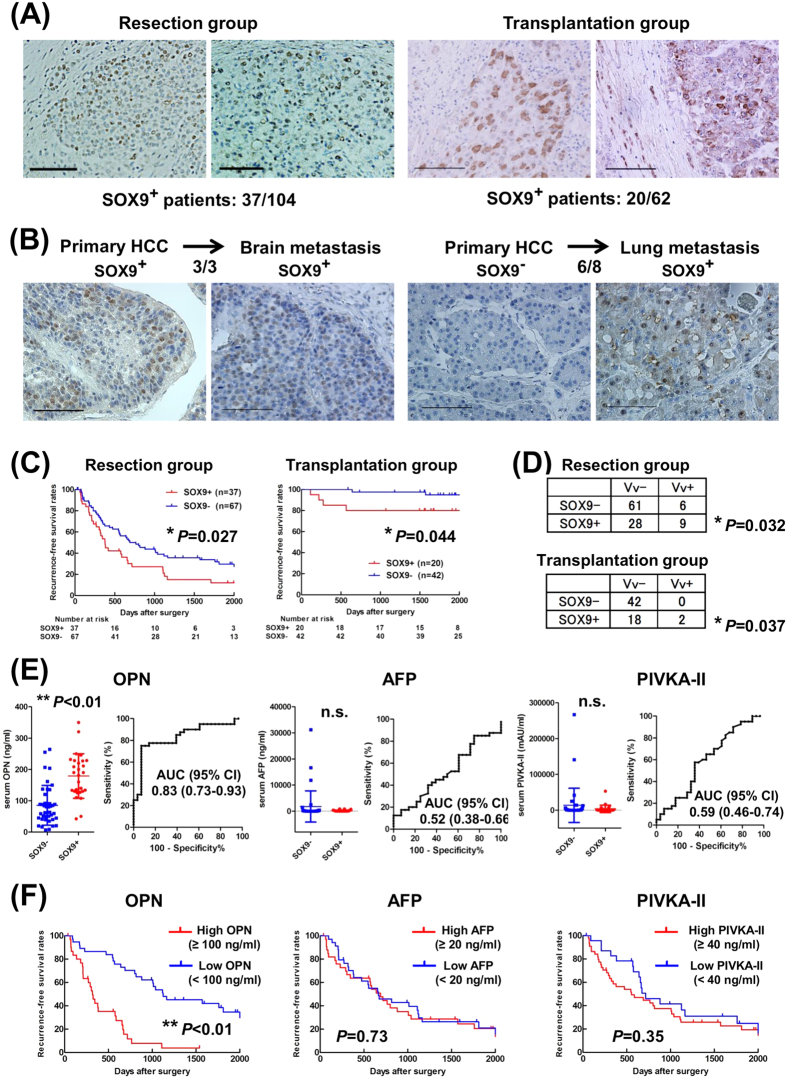
Figure 6. SOX9 and OPN expression in human HCC.
(A) Representative pictures of SOX9-expressing tumor in the resection group (left) and two patients in the transplantation group (right). (B) High incidence of SOX9 expression from SOX9+ (left) and SOX9− HCCs (right). (C) Recurrence-free survival rates. Note the significantly higher recurrence (log-rank test, *P = 0.027 in the resection group (left), *P = 0.044 in the transplantation group (right)). (D) Correlation between SOX9 expression and venous invasion (Fisher’s exact test, resection group; *P = 0.032, transplantation group; *P = 0.037). (E) Serum levels and ROC curve evaluating the performance of serum OPN, AFP, and PIVKA-II levels in predicting SOX9 expression in HCC. Each line in left panel indicates median levels with 95% confidence interval (CI). SOX9+ patients had significantly higher serum OPN than SOX9− patients (Mann-Whitney U test, **P < 0.01). (F) Recurrence-free survival rates of 68 HCC patients in terms of serum level of OPN or AFP or PIVKA-II (log-rank test, OPN; **P < 0.01, AFP; P = 0.73, PIVKA-II; P = 0.58). Scale bar represents 100 μm (A,B).

