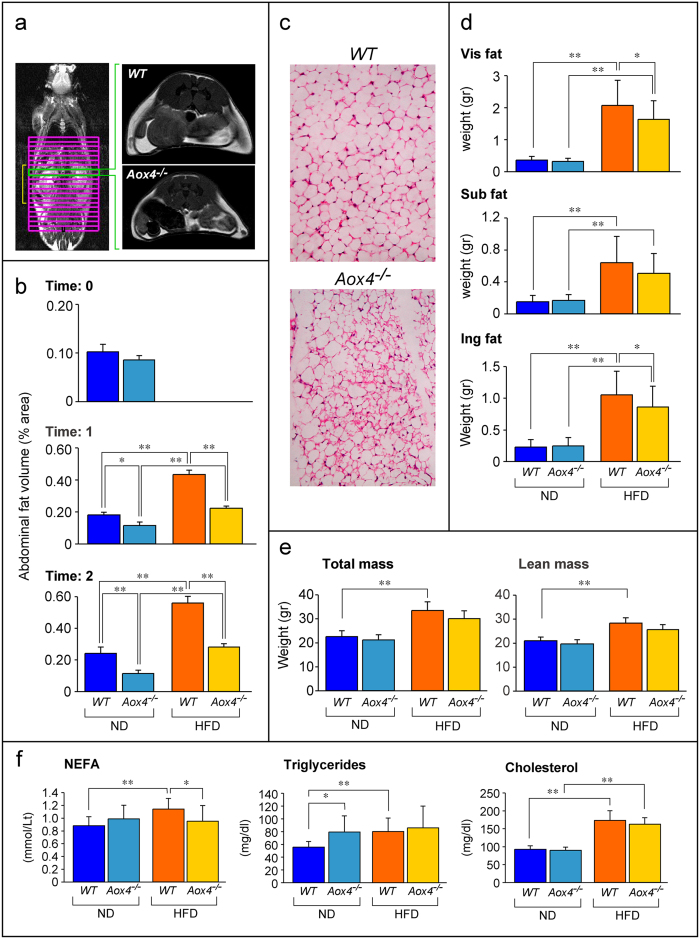
Figure 6. Reduced fat accumulation in Aox4−/− WADT.
(a) The panel on the left illustrates a representative whole-body MRI performed on a WT mouse. The grid indicates the image sections (yellow square parenthesis) used for the determination of abdominal WADT volume. The two right figures show representative images of visceral adipose tissue sections of animals fed ND. (b) The graphs show the total abdominal fat volume measured by MRI in Aox4−/− and WT animals fed ND or HFD for 1 month (Time:1) or 2 months (Time:2). Values are the mean ± SD of 6 animals. (c) The images show typical microscopic fields (magnification x100) of inguinal WADT in mice fed HFD for 2 months. (d) The graphs illustrate the weight of visceral (Vis), subcutaneous (Sub) and inguinal (Ing) WADT in mice subjected to ND or HFD for 5 weeks. Values are the mean ± SD of 9 mice under ND and 16 mice under HFD. (e) The graphs show the total and lean mass of mice subjected to ND or HFD for 5 weeks. Values are the mean ± SD of the same number of mice as in (d). (f) The graphs show the serum levels of NEFA (non-esterified fatty acids), triglycerides and cholesterol measured in Aox4−/− and WT animals subjected to ND and HFD for 2 months. Each value is the mean ± SD of 10 distinct mice. Significantly different: *(Student’s t-test, p < 0.05), **(Student’s t-test, p < 0.01).

