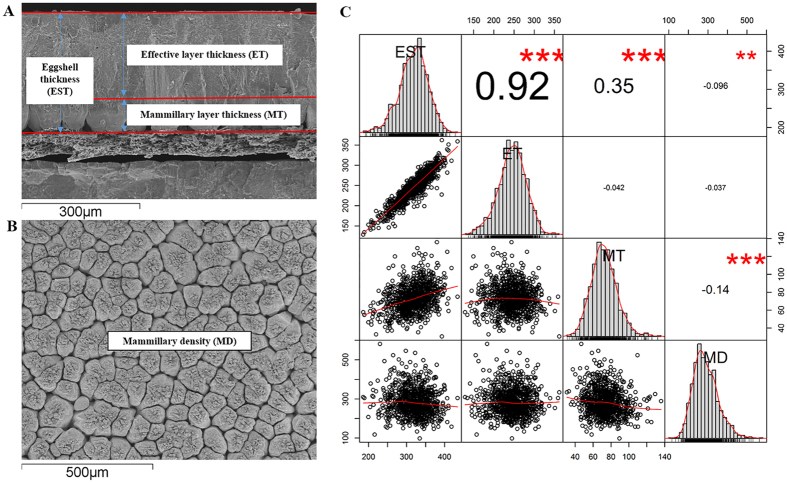
Figure 1.
Illustration of eggshell ultrastructure traits (A,B) and the correlation matrix plots among them (C). EST, ET, MT and MD represent eggshell thickness, effective layer thickness, mammillary layer thickness and mammillary density, respectively. On the diagonal are the univariate distributions, plotted as histograms and kernel density plots (C). On the right of the diagonal are the phenotypic pair-wise correlations, with red stars indicating significance levels (***p ≤ 0.001, **0.001 < p ≤ 0.01, *0.01 < p ≤ 0.05). On the left side of the diagonal is the scatter-plot matrix, with LOESS smoothers in red to illustrate the underlying relationship.

