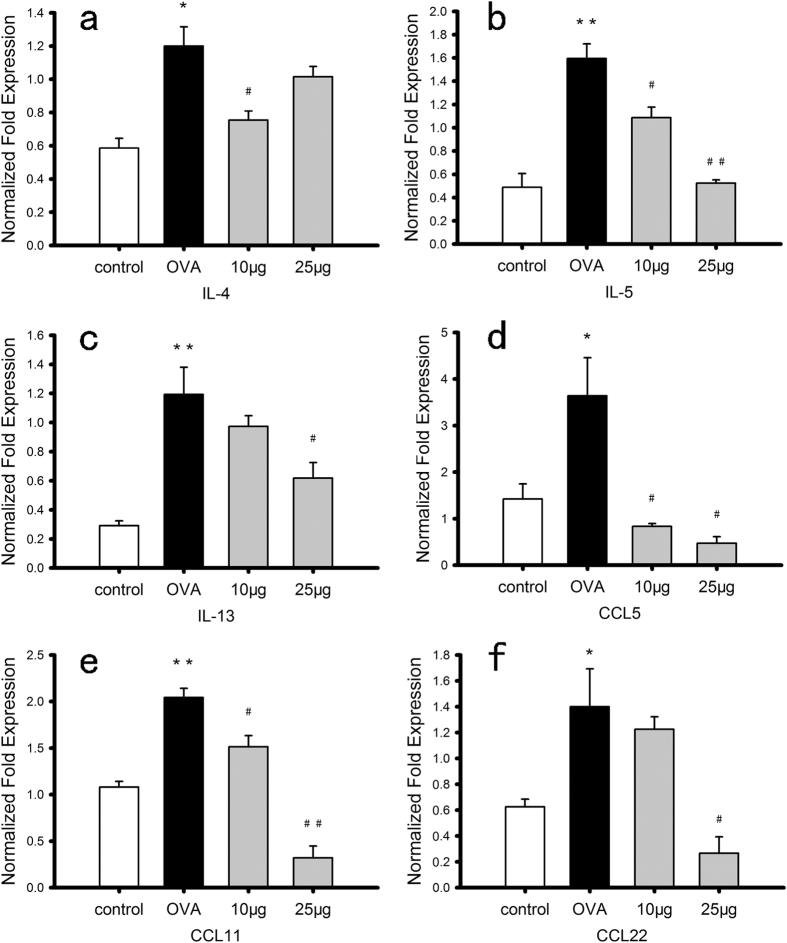
Figure 4. mRNA expression of TH2 cytokines in total lung tissue from different groups of Balb/c mice.
The level of mRNA expression was quantified by RT-PCR with detection of β-actin and glyceraldehyde-3-phosphate dehydrogenase (GAPDH) as endogenous controls. Panel a–f display the normalized fold expression of IL-4, IL-5, IL-13, CCL5, CCL11, and CCL22, respectively, for mice of control group (control), OVA-sensitized and challenged group (OVA), and group of OVA-sensitization with BK-1361 treatment at either dose of 10 μg (10 μg) or 25 μg (25 μg). Data are representative of two independent experiments with n = 3–4 age-matched female mice per group. Result are expressed as mean ± SEM. *P < 0.05, **P < 0.005 versus control. #P < 0.05, ##P < 0.005 versus OVA.

