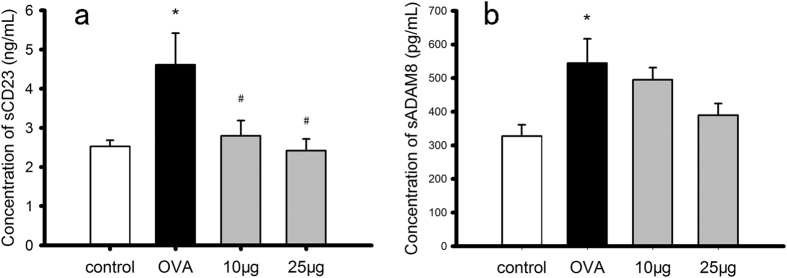
Figure 5. Concentration of soluble CD23 (sCD23) and soluble ADAM8 (sADAM8) in soluble protein fraction from different groups of Balb/c mice.
The concentration of sCD23 and sADAM8 was quantified by ELISA, and is displayed in Panel a and b respectively, for mice of control group (control), OVA-sensitized and challenged group (OVA), and group of OVA-sensitization with BK-1361 treatment at either dose of 10 μg (10 μg) or 25 μg (25 μg). Each experiment was performed in duplicate or triplicate with n = 5–6 samples per group. Result are expressed as mean ± SEM, *P < 0.05.

