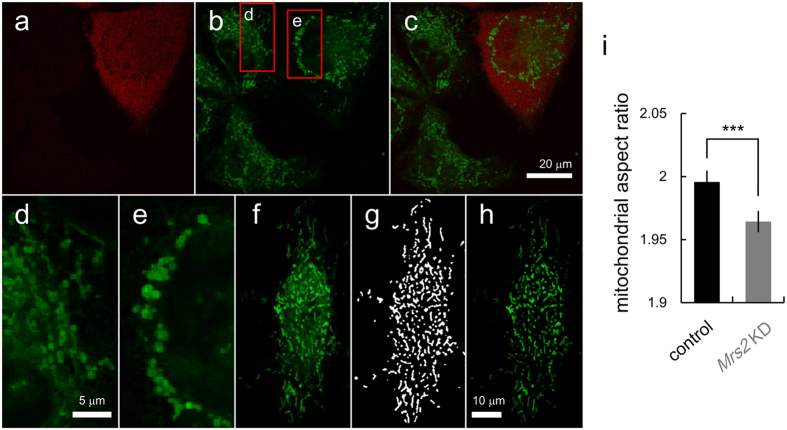
Figure 5. Morphological analysis of mitochondria in control and Mrs2 KD cells.
(a) Mrs2 KD cells were labeled with tagBFP. (b) In control and Mrs2 KD cells, mitochondrial location and shape were visualized with MitoTracker Green FM. (c) The merged image was shown (green: mitochondria, red: Mrs2 KD cells). (d,e) The enlarged images of boxed area in panel b in control (d) and Mrs2 KD cells (e). (f) Representative image of mitochondria stained for digital image processing. (g) Binary image of mitochondria shown in panel (f). (h) Fluorescent image of mitochondria masked with mitochondrial binary image shown in panel g. (i) Comparison of aspect ratio (AR) of mitochondrial shape between in control and in Mrs2 KD cells. The AR of mitochondria in Mrs2 KD cells was smaller than that in control cells, suggesting the rounding of mitochondria (mean ± SEM; n = 20628 mitochondria in 109 cells for control and n = 20159 mitochondria in 84 cells from 8 experiments).

